Nieuwsbrief juni 2016

Aan het begin van juni trok ik eerst even naar Zwitserland. Zolang er nog nachttreinen zijn moet ik die toch gebruiken. Aan het einde van het jaar gaat de DB jammer genoeg al zijn nachttreinen afschaffen. Met een van die nachttreinen geraak je helemaal tot in Zürich. Van daar ging het nog verder richting Sankt Gallen waar ik met Siebrig eens de Toggenburger Höhenweg zou gaan lopen. Die doorkruist een ferm stuk van het kanton van Wil naar Wildhaus. Wij kozen voor een lage start in Wil. In eerste instantie loop je daar hoofdzakelijk over brede bospaden. Het hoogtepunt van dat eerste stuk is zonder enige twijfel een mooie hoge waterval waar je helemaal achter door kan.
In de namiddag kwamen we dan hoger en hoger en werden de uitzichten talrijker en spectaculairder. De hele dag lang hingen wolken dreigend aan de hemel. Tegen de avond was ons geluk dan toch op en kregen we een ferme regenbui over ons heen. Gelukkig zaten we toen in het bos zodat we ze niet al te hard gevoeld hebben. Het resultaat was wel dat de paden interessant glibberig waren. Bij het laatste daglicht gingen we op zoek naar een plaatsje voor de tent en vonden dat aan de rand van een bos. We stonden er droog, wat verborgen van het pad en hadden een prachtig uitzicht. Meer hebben we echt niet nodig.
De volgende ochtend vatten we dan het hoge stuk van de Toggeburger Höhenweg aan. We kwamen er achter dat zelfs op lage hoogte nog behoorlijk wat sneeuw lag. Vanaf 1600 meter hoogte waren er nog talrijke sneeuwplekken. Verschillende waren ook behoorlijk groot en regelmatig moesten we een volledig besneeuwde kom door. Het grootste deel van de tijd was dat geen enkel probleem maar er zat toch een spannend stukje in. Het sneeuwveld was er erg stijl, nog erg hard en een val zou ongetwijfeld fataal geweest zijn. We zijn zo verstandig geweest om daar niet te vallen of uit te glijden.
Na al de hoge stukken was het dan gewoon dalen naar de vallei om terug te keren. Met een hele reeks bussen en treinen met nipte aansluitingen die alleen in Zwitserland als realistische optie beschouwd worden geraakten we in Baar. Daar was Erika zo lief om ons wat te voederen. Daarmee zat het weekend erop en was het voor mij tijd om de nachttrein terug naar huis te nemen.

Twee weken later ging ik wat verder naar het zuiden en vloog voor de derde keer dit jaar naar Italië. Deze keer was Bologna de bestemming. Met de trein sta je van daar erg vlot in de Apennijnen, waar ik redelijk op goed geluk wat begon rond te lopen. Uiteindelijk werd het met wat omwegen een route van San Benedetto naar Porretta Terme.
De Apennijnen zijn daar niet erg hoog zodat de bergen bijna volledige bebost zijn. Daarmee heb je natuurlijk iets minder uitzichten, maar anderzijds zorgt dat er ook voor dat je in de schaduw loopt. Daarmee blijven de temperaturen ook wat draaglijk. Ik had er op voorhand niet echt bij stil gestaan dat zo ver zuidelijk het kwik midden juni al behoorlijk kan oplopen.
Direct bij aankomst was duidelijk dat ik in warmere gebieden terecht was gekomen. De eerste nacht sliep ik omringd door vuurvliegjes. Rond mij lichtten de struiken voortdurend op. Een heel verschil met de paar verspreide lichtjes die je ziet als er bij ons ergens vuurvliegjes zitten.
De kwaliteit van de paden is in dit gebied dan weer Italiaans. Meestal zijn ze erg mooi, maar de markeringen zijn niet altijd evident. Je moet er een beetje geluk mee hebben. Op de stukken waar redelijk wat volk komt is er geen enkel probleem. De stukken die minder begaan zijn kunnen dan weer behoorlijk overwoekerd geraken. Het is niet altijd simpel om er een weg doorheen te banen en dan nog eens op het pad te blijven. Ik ben in elk geval een paar keer behoorlijk het noorden kwijt geraakt.

Helemaal aan het einde van de maand trok ik dan nog eens naar Frankrijk voor een wedstrijd. Samen met Renaud ging ik in de Beaufortain de Pierra Menta lopen. Dat is een wedstrijd in drie etappes waarbij je in ploegen van twee loopt. Die twee moeten de hele tijd samen lopen. In totaal is de afstand ongeveer zeventig kilometer, wat zeker en vast haalbaar is. Op die afstand moeten in totaal 7000 positieve hoogtemeters (en evenveel negatieve) overwonnen worden. Dat is toch een respectabel aantal.
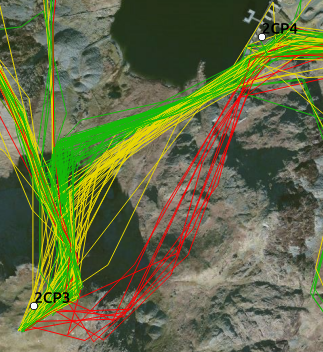
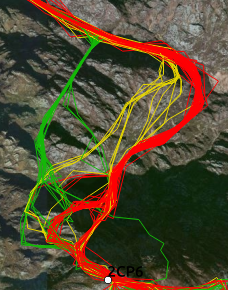
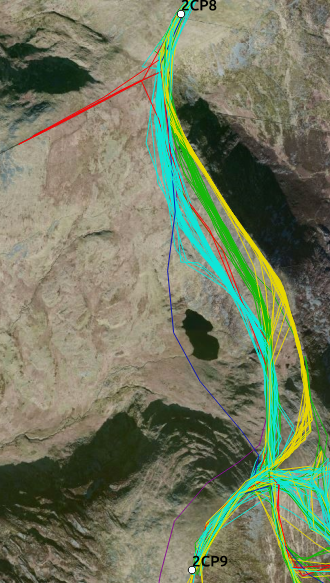
De eerste etappe startten we behoorlijk voortvarend. Met mijn achillespeesproblemen van de laatste tijd bleek dat toch wat optimistisch. Ik ben gewoon totaal ondertraind en in de eerste beklimming blies ik de motor helemaal op. In combinatie met een warme dag zou ik er de hele etappe niet meer van herstellen. Het wedstrijdverloop voor ons was dus dat ik steeds meer terrein verloor en Renaud aan elke checkpoint op mij stond te wachten over verder te kunnen gaan.
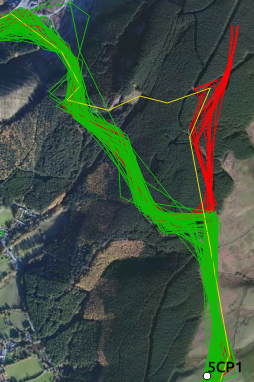
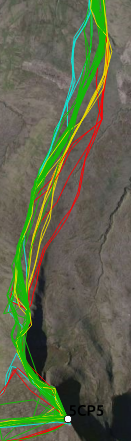
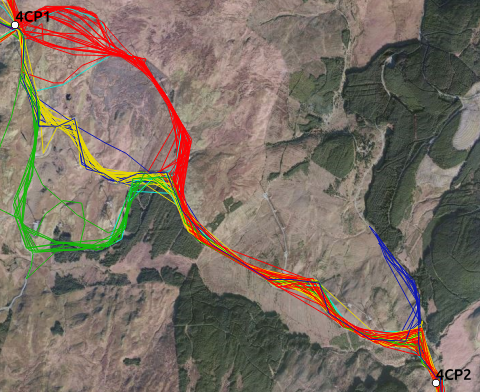
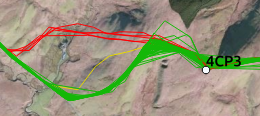
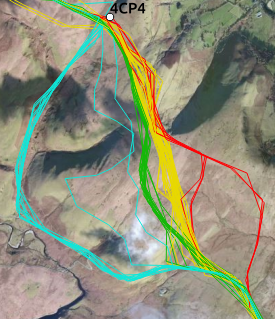
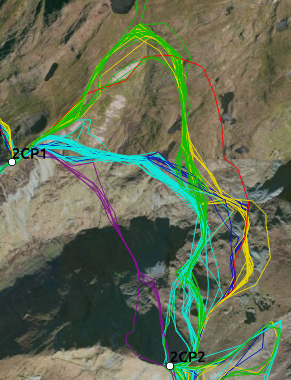
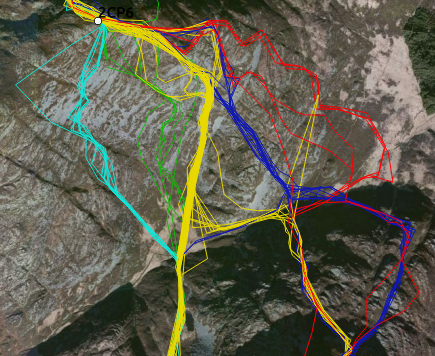
Het parcours van die etappe was zeker wel de moeite. In essentie ga je twee keer recht omhoog en daarna terug recht omlaag.
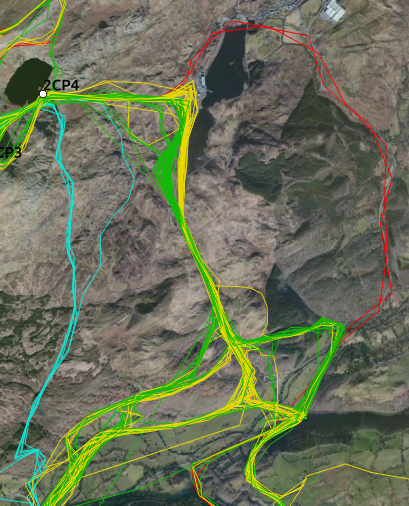
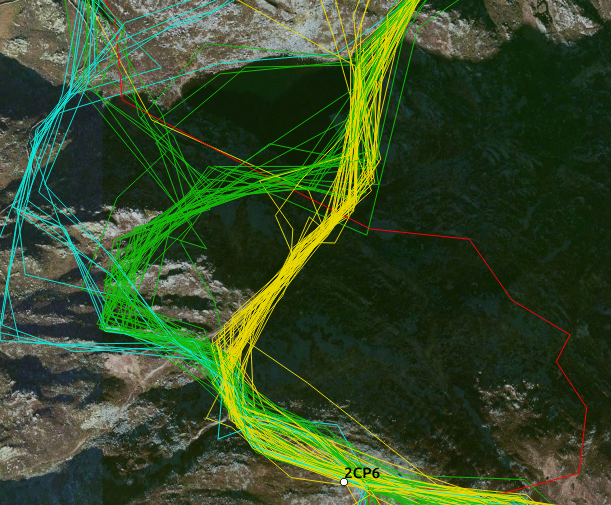
De start van de tweede etappe was nog veel dramatischer. Na de eerste etappe liet mijn achillespees het volledig afweten en had ik moeite om te stappen. Bij de start van de tweede etappe was dat nog altijd zo. Lopen zat er al helemaal niet in. Met de moed der wanhoop begonnen we te stappen en al snel liep iedereen van ons weg. Naast ons wandelden twee mannen mee die de markeringen opruimden. Dan weet je dat je een probleem hebt.
Op een licht dalend stuk lukte het toch om wat te lopen waarna mijn pees genoeg opgewarmd was om zonder manken te kunnen stappen. Dat deden we dan ook in de volgende beklimming en haalden zelfs een paar ploegjes in. Groot nadeel van helemaal achteraan zitten is dat daar de files zitten. Bij een klein rotsje op het pad waar je even je handen moest gebruiken stonden we direct twintig minuten stil. De etappe bracht ons naar de top van de Grand Mont. Bijster origineel zijn de namen van de bergen daar niet. Om op die Grand Mont te geraken passeerden we over een aantal graten waar we met een via ferrata kit moesten gezekerd lopen. Naar mijn mening was dat behoorlijk overdreven. Ik heb al wedstrijden gelopen waar je dergelijke passages gewoon over loopt zonder dat er veel spel van gemaakt wordt. Het grote nadeel daarvan was vooral dat aan het eerste gezekerde stuk terug een gigantische file stond. We stonden er een half uur stil alvorens verder te kunnen. Als je een beetje wil doorlopen zor
g je duidelijk best dat je vooraan zit. Achteraan is al het wachten echt niet leuk.
Na de Grande Motte volgde een afdaling over een paar leuke sneeuwvelden. We konden er een paar keer schitterend over omlaag glijden. Beneden was het dan zaak om zo snel mogelijk terug recht te staan en verder te lopen. Anders riskeerde je dat de volgende loper tegen je aan gleed. Op een bepaald moment zaten we zo met vijf lopers op elkaar geknald. De rest van de afdaling was behoorlijk glibberig door een onweer de vorige nacht wat me verrassend goed afging. We vlogen een heel pak ploegen voorbij.
De daarop volgende beklimming was dan weer een heel pak minder. Daar probeerde ik gewoon onze positie te handhaven. De afdaling erna was terug erg leuk. Het was een lange zigzag over een bijzonder steile helling. Enige nadeel was terug dat je af en toe achter wat trager verkeer bleef vastzitten. Aan de aankomst bleek dat we onverhoopt toch nog een derde van alle deelnemers hadden voorbij gelopen.
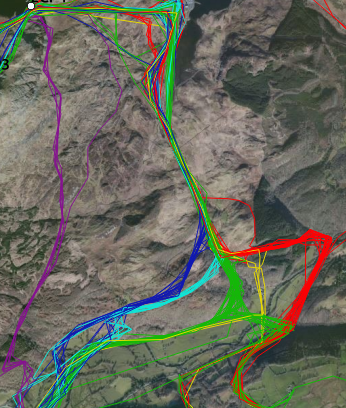
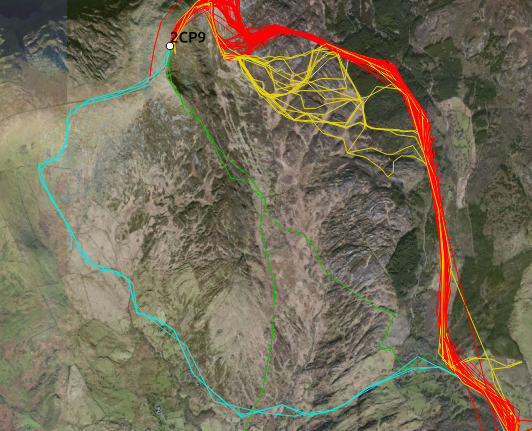
De laatste etappe was mijn achillespees dan weer behoorlijk goed. Van bij de start kon ik behoorlijk mee. Renaud besloot zich eens helemaal uit te leven en vertrok bij de eersten. Aan het eerste checkpoint stond hij dan braafjes op mij te wachten. Die laatste etappe was in essentie eens de Roche Parstire op en af lopen. Het laatste stuk van de klim was nog een leuk stukje: erg stijl en regelmatig wat klauterwerk. In de afdaling liet mijn conditiegebrek zich toch wat voelen. Het was behoorlijk afzien voor mij, maar de laatste etappe bleef veruit onze beste.
Ik houd in elk geval een schitterende herinnering over aan de Pierra Menta. Het parcours heeft een paar schitterende technische passages en de sfeer is er helemaal fantastisch. Ik kan het zeker en vast aanraden.

Van de Pierra Menta reisde ik direct door naar la Chapelle d’Abondance, wat een beetje verder naar het noorden in de Franse Alpen ligt. Alke had daar een hele hoop Nederlandse en Vlaamse traillopers uitgenodigd voor een week in zijn hotel (Hotel Esprit Montagne, echte aanrader om hem een beetje reclame te geven). In de loop van die week organiseerde hij ook een paar onderlinge wedstrijdjes. Het eerste was een verticale kilometer op maandag. Voor mij was dat dus de dag na de Pierra Menta. Daarbij gingen we naar de top van de 2432 meter hoge Cornettes de Bise. Ik was natuurlijk niet erg snel en duwde ook niet echt door.
Op donderdag voorzag hij dan de hoofdmoot met een toer van ongeveer 85 kilometer met 9000 hoogtemeters. Voor mijn pees was dat veel te steil. De afdalingen en klauterstukken ging nog, maar eens de hellingsgraad van de beklimmingen wat toenam geraakte ik alleen zijwaarts omhoog. Dat kan je wel eventjes doen, maar over zo een lange toer gaat de lol er toch snel af. Na een paar uurtjes ben ik dan ook teruggekeerd naar het hotel en heb in de loop van de dag nog wat meegeholpen bij de verzorgingsposten. Het was een erg aangename week waar ik door mijn fysieke toestand jammer genoeg iets minder heb kunnen profiteren dan ik zou willen.

Posted in Algemeen | Leave a comment

How to kill a dragon?


During the Dragon’s Back Race runners cross Wales over a five stage race. Every day a certain number of checkpoints needs to be visited, but between those checkpoints the route is free. Most of the time, the best route is rather obvious, but on occasions multiple options are possible. A big point of talk are the different options taken. Which one is the best? Which one is the fastest? Which one makes sure you don’t get lost?

In 2015, following the race became easier for armchair fans: every runner carried a GPS tracker. So you could see where they were during the day. And now we can know where everyone went during the race. Can we draw any conclusions from those data about route choices?

Day by Day

This is the kind of question that I try to answer here.
If you are just curious, you can just move on to the overview for every day.
Day 1
Day 2
Day 3
Day 4
Day 5

How and such

For those interested, I give a short methodological overview. First of all, the input data. Simple. There are two kinds of data used in the analysis.
One is the tracks as they were available via the live tracking on the website. Theoretically there is one point every 1.5 minutes, which theoretically should be correct within a few meters. Reality is always a bit more involved, but in general the tracks show rather clearly where the runners went. Some tracks are missing or partly missing. I assume this is due to a malfunctioning of some kind. There are also some spurious points, strange artefacts etcetera, but nothing you wouldn’t expect from GPS tracks. The 1.5 minute time interval reduces of course the precision of the data. Generally, runners can travel about 100 meters in that time. Its main implication is that close parallel options are near impossible to distinguish.
The second part of data are the intermediate times, as they are given by the race results. Those come from SI-dibbers, which is in general flawless. There are a few exceptions with missing data points and spurious values, but in general those times are very reliable.

My main objective was to find out differences in time between different route choices. And also to see what are the different choices made by the runners. Maybe I overlooked an interesting option during my race, that was spotted by others. The first question to answer is how you define a fast option. If you merely look at the times run, the fastest option will be the option chosen by the fastest runners. Which is not necessary interesting.

OK. First I’ll give some definitions. For me the race is divided in five stages. So, a stage is a day of running from camp to camp. Times for a stage vary from 7 to 16+ hours. Each stage is divided into multiple legs. For me, a leg is between two checkpoints. So, each of the five stages is divided into 9 to 23 legs (equalling the number of intermediate checkpoints of the day plus one). Times for each leg can vary between a few minutes to many hours. Just keep this in mind. It is the terminology that I will use everywhere.

My take on the problem was to convert all the leg times to a percentage of the stage time. The assumption is of course that this percentage is stable among all the runners. This assumption turned out to be rather correct. If you plot the percentages for each leg, you find a very nice flat line (with some exceptions, but I’ll mention that when we get there). This gave me a good way to work with the intermediate times.

Obviously, there is a very high correlation among those percentages: the sum of all percentages of one runner must be 100%. In normal language, if you make a stupid mistake at some point you will have a high percentage for the leg in question. But this implies that the percentages for the other legs get pushed down because the sum has to be 100%. So it looks as if you were running relatively fast, while this was possibly not the case. I ignored this correlation and treated the percentages as random variables. This is obviously not correct, but good enough for our purposes. And it simplifies everything enormously. The error made due to this will be the biggest in long legs of stages with few legs.

For the route options, the best starting point is just looking at the tracks on a map. Visual inspection reveals if there was variation in the ways taken. If everybody followed the same obvious path it makes no sense to make a further analysis. If there were different option, I manually identified those. For each track I manually decided to which option they belonged. Mistakes made in the classification are entirely my own. I’ve also experimented with a kNN-classifier, but in the end making the classification manually turned out to be both quicker and more accurate.

The implicit assumption is that all runners need the same percentage of their stage time to cover a specific leg. Then, if for all runners taking a specific route choice this percentage is higher than for the runners taking another route choice, we can assume that the former route was simply slower than the latter route. I want to stress that correlation does not imply causality. The causality might be the other way around. Maybe tired, slowing runners tend to prefer a route which looks easier (e.g. less elevation change). The choice of the route can certainly depend on how you feel at a particular moment. It is also useful to stress that the optimal will depend on the circumstances, especially the weather. Under different circumstances, and they will definitely be different during a next edition of the race, other choices might be better than the optimal choices of 2015. Furthermore, there is absolutely no guarantee that any part of the 2015 race will be part of next editions. Though some parts are of course very likely to be a part of all Dragon’s Back Races.
It has been announced that from 2017 on the map will contained an advised line. The data that you find here might help you spot the places where it is interesting to sneak to an alternative option.

The analysis is every time limited to runners that finished the stage. Otherwise it doesn’t make a lot of sense to calculate the percentage of the stage time. All times are given in minutes.

Distribution over stages

As a way to get started, I start by taking a look at how the distribution over the different stages looks like. Obviously, I won’t make any attempt to link this to route choices, but it might give an idea of the stages where people lost time.

Only 65 runners are ranked in the final standings. For those 65 this are histograms of how much time they spent on each of the stages.

The average percentage of finish time needed for each of the subsequent stages is 18.9%, 21.1%, 21.6%, 20.4% and 18.1%. As all participants probably figured out, the longest stages are the second and third stages. The first and last stages are the shortest ones. The first one feels a bit longer then it really is because you are still fresh, it has lots of elevation change and you start later than during the other stages. The spread is clearly larger on the last stage than on the other stages. I’m not sure if this is because some people were struggling to the finish line, or if it has to do with the weather conditions. During this last stage we got some foggy conditions making the navigation a lot more tricky than during the rest of the race. I might simply be the difference between people nailing the navigations and people loosing lots of time when they get lost or spending a lot of time to avoid getting lost.
Next, let’s see if this distribution over the stages changes with finish time.

This is for each of the stages a scatter plot showing the percentage of time spent on the stage in function of the total time. To consider differences between faster and slower runners, I’ve added a linear regression line. In order to read this you have to realise that for each runner there are five dots: one on each plot and those five dots are on a vertical line. We see some nice examples of the correlation between those percentages. The runners that are very bad (very high percentage) on one stage are usually relatively good (low percentage) during another stage. I’ll give two examples.

There is the runner who spent almost 25% of his race on stage 2. This is the rightmost bar in the histograms. We see that the same runner spent (relatively) the least time on stage 5 of all runners. So this same runner is the leftmost bar in the histograms. It is an example of someone who had a rough day during the second stage and made a big dive in the ranking on that day. Afterwards, he recovered and started moving up again in the rankings. I know because it’s me.

Another nice example is the runner who ran slightly more than 3500 minutes over the entire race. I won’t say who he is, but let’s call him Ally. In the first two stages he ran very fast for someone with his total time. You see that both times his dots are very low. During the last two stages, on the other hand, his dots are very high, indicating that we was very slow for someone with his total time. It is an example of a fast runner who got physical issues halfway through the races and ended up struggling to the finish line with the back of the packers in the last stages.

If you find yourself, the stages where you are above the line will be the stages where you had the most difficulties, while the stages where you are below the line are when you had a blast. Don’t be disappointed if you are not all the time below the line. That is impossible.

A logical question to ask is if there is a difference between faster and slower runners. We see that during stages 1 and 3 the regression line has negative slope, while during stages 4 and 5 it has a positive slope. This means that faster runners spent relatively longer on stages 1 and 3 and less time on stages 4 and 5. Or, another way to turn this is that the faster runners are better at keeping up the pace over the five stages, while slower runners are slowing while the race progresses. For the more mathematically inclined readers I give the slopes of the regression lines with a 95% confidence interval for each of the five stages: -6.2e-06 (-1.2e-05; -7.9e-07), -3.0e-06 (-8.4e-06; 2.4e-06), -6.7e-06 (-1.1e-05; -2.9e-06), 8.8e-06 (4.8e-06; 1.3e-05) and 7.1e-06 (5.3e-07; 1.4e-05).

Posted in Lopen, Ultra | Leave a comment

How to kill a dragon? Day 5

Day 5 of the Dragon’s Back Race. The final day. This stage is a bit shorter to allow all those still in the race to finish somewhat comfortably. After a few first legs without obvious choices, the runners enter the Brecon Beacons. Also there the options are limited. Don’t expect too many shocking results from this stage. You need to run quickly. That is about it.

The entire stage

The fastest time was run by Jim Mann with 426.4 minutes.
The median time was 699.7 minutes.
Below are the histograms of the percentage spent over each leg.

The longest legs are clearly 4 and 5. The runners spent there almost 20% of the stage.

My basic assumption that the percentage is independent of running time looks rather OK here. A quick look on the error bars for the slopes of the regression lines should confirm that.

Not perfect, but I can live with that. It is good enough for me.

Just as for the previous stages, I made a set of boxplots. This is mine.

By now you probably got the drill. Again, they are for all runners available in a zip file.

Leg 1

The fastest time was run by Jim Mann with 37.7 minutes.
The median time was 62.3 minutes.
This leg is kind of obvious. Or at least it should be.

We see that not all runners agreed. Most (67) took the obvious green line. But some (red, 8 runners) thought there would be something very nice to see up north. And one runner (Konrad) made an original choice (yellow).

No surprises. Red is getting lost and doesn’t buy you anything.

Leg 2

The fastest time was run by Konrad Rawlik with 29.5 minutes.
The median time was 47.2 minutes.
There are no interesting choices to make.

Leg 3

The fastest time was run by Jasmin Paris and Jim Mann with 20.7 minutes.
The median time was 32.7 minutes.
Also no interesting choices.

Leg 4

The fastest time was run by Jasmin Paris and Jim Mann with 49.5 minutes.
The median time was 123.2 minutes.
During this stage you can make a few choices.

A first big choice comes leaving Llandovery. There are two more or less parallel roads. Either you take the southern one (yellow, 67 runners) or the northern one (red, 9 runners).

Conclusion: whatever. It totally doesn’t matter.

Then, you can pick a line going over the pass and descending to the forest.

The most popular option is to follow a rather straight line (62 runners, red). Alternatively, some (14) runners made a wider turn to the west.

We see again no difference, but here it is certainly possible that any possible effect over this short stretch drowns in what happened over the entire leg.

Leg 5

The fastest time was run by Jasmin Paris with 69.8 minutes.
The median time was 111.7 minutes.
There is no obvious path once leaving the forest and climbing to the ridge.

I identified four different lines, from east to west drawn in red (5 runners), yellow (7 runners), green (60 runners) and cyan (4 runners).

Unsurprisingly, it doesn’t really matter. No line is really fast or slow. Just keep going in the right direction.

Leg 6

The fastest time was run by Jim Mann with 42.9 minutes.
The median time was 62.2 minutes.
From this leg on, you will see that almost all of the runners finishing in less than 500 minutes are on a diagonal line and have the same colour in the scatter plots. This is because they were running together. During this leg you basically run straight east following a ridgeline. For most of the runners a thick fog came up during this leg which made it certainly harder to keep the correct direction. The tracks show a big variation and I classified them in two different ways.

A first classification is how runners passed the summit of Bannau Sir Gaer. This is after about a quarter to a third of the way from CP5 to CP6. From north to south those lines are red (10 runners, passing the summit), yellow (28 runners), green (30 runners) and cyan (5 runners).

We see that it doesn’t matter a lot. Cyan doesn’t impress me and is probably overshooting to the south. Also red is a bit slower, but might be good if you doubt your navigation a lot. Between green and yellow there is no real difference.
I also looked for the lines that were followed to approach CP6. This second classification was made about two thirds into the leg, basically considering the line used after Waun Lefrith.

Again going from north to south the lines are red (8 runners), yellow (22 runners), green (30 runners), cyan (12 runners) and blue (4 runners).

Very colorful, but that doesn’t lear us a thing. The exact line doesn’t really matter. Just keep going towards the checkpoint and you’ll be fine. Among the fast runners we see that Konrad lost some time by going further south than the other fast runners.

Leg 7

The fastest time was run by Damian Hall with 51.7 minutes.
The median time was 85.8 minutes.
During this leg you run first south to the end of a valley before heading west to CP7. Again, many lines are possible as there is no real path. As a starter I will look at the lines used to leave CP6.

From east to west the lines are red (11 runners), yellow (36 runners) and green (29 runners).

None of the lines are really faster, but it looks like yellow is the most intersting line. On green and red the spread is bigger, so there you run the risk of loosing time.
Secondly, I classified by the point of making the turn.

My classification is from north to south shortly after the turning point. From north to south we see red (11 runners), yellow (26 runners), green (11 runners), cyan (17 runners), blue (6 runners) and 5 runners that were overshooting it in magenta.

I would say that red, yellow, green and cyan are all fine, but that blue and magenta start to overshoot it.

Leg 8

The fastest time was run by Damian Hall with 24.0 minutes.
The median time was 37.2 minutes.
This is a rather short leg, where you first descend to a road and then shoot for a summit at the other side of the road. This is also without paths, so the lines are not clearly definined.

I classified again from north to south in red (15 runners), yellow (49 runners) and green (11 runners). Finally there is Filip who got lost to the south (cyan).

Yellow and red look more or less equivalent. Green is on the high end so a bit slower. And cyan is desastrous. It easily takes twice as long as the other options. But nobody would make that choice on purpose, I think.

Leg 9

The fastest time was run by Charlie Sharpe with 30.3 minutes.
The median time was 48.1 minutes.
Another short leg with no clear path. The trick was following a good line in the fog.

My classification is made at the point where the track spread out the widest. From north to south there are red (4 runners), yellow (41 runners), green (9 runners), cyan (17 runners) and blue (5 runners).

Again, there is no clear winner. The most remarkable is how the faster runners went for cyan, while the second half went rather for yellow-green.

Leg 10

The fastest time was run by Pavel Paloncy with 29.1 minutes.
The median time was 53.2 minutes.
Pavel was here spectacular, running seven minutes faster than any other runner. That is a lot over such a short leg.

Most (42, yellow) runners took a rather straight line to the final mandatory part. The red line are seven runners that started a bit more to the north. Another popular option was to head straigth for the road and start following that (cyan, 16 runners). Finally, there is green which is a bit between yellow and cyan (12 runners).

The result is a bit of mixed bag. I think that the result here depends more on the remaining motivating to blast to the finish line, rather than on the route choice made.

So, that was it for the entire race. Now you know how you can kill a dragon in only five days. The most important lesson is that you should avoid getting lost and if it is not obvious from the map which choice is the best, it usually doesn’t matter which one you take.

Overview
Day 1
Day 2
Day 3
Day 4

Posted in Lopen, Ultra | Leave a comment

How to kill a dragon? Day 4

Day 4 of the Dragon’s Back Race is for me the least interesting stage. It contains a rather big amount of road running, including a very long descent to reach the finish line.

The entire stage

The fastest time was run by Jim Mann with 478.8 minutes.
The median time was 767.3 minutes.
Below are the histograms of the percentage spent over each leg.

By far the longest leg is the last one, where the runners spend around 30% of the entire stage. When you get the map it is really an impressivly long line. Like for the previous two stages, I provide a scatterplot

My basic assumption that the percentage is independent of running time looks rather OK here. A quick look on the error bars for the slopes of the regression lines should confirm that.

Not perfect, but I can live with that. It is good enough for me.

Just as for stages 1, 2 and 3, I made a set of boxplots. This is mine.

You see clearly where I had bad patches and made stupid mistakes. And that as a former marathoner I am still able to pick up speed in the final road leg. Even though my road running days are more than a decade behind me. Again, they are for all runners available in a zip file.

Leg 1

The fastest time was run by Jasmin Paris with 45.3 minutes.
The median time was 76.1 minutes.
This leg crosses first a big stretch with no obvious paths in the correct direction before entering a wind farm where roads are sometimes in the correct direction and sometimes not.

In the central part, the lines are a bit messy. I tried to separate by the way they approached the checkpoint. Most of the runners (24) followed the yellow line. The red line are runners that followed a road a bit more to the north (15 runners). To the south of the yellow line is the green option (15 runners). Finally, there is cyan (13 runners), which involves following clear tracks down a valley and up again.

Cyan is clearly a bad choice. No surprise, it is longer and has more elevation change. The other options are rather similar where yellow (mean of 9.5%) has a slight edge over red (9.8%) and green (10.0%). Next time, I would try yellow.

Leg 2

The fastest time was run by Konrad Rawlik with 36.5 minutes.
The median time was 54.6 minutes.
This is a leg that looks rather obvious with possibilities for lots of fast running.

There are again three big lines, this time defined by the way you leave checkpoint 1. There is a northern options that starts a bit cross country before hitting roads (25 runners). Alternatively, there is yellow that follows some roads further south (22 runners). The green option (12 runners) starts like the yellow one, but afterwards makes a loop to the south. It looks a lot like missing the turn for yellow. Finally, blue (6 runners) and cyan (2 runners) include some obvious mistakes. Cyan starts like red, but starts following green in the wrong direction when they join, while blue thinks running away from the checkpoint is any help.

The options of getting lost are obviously slower. Yellow and red look completely equivallent, while green looks a bit longer. Logic, because green is a longer version of yellow. I think it doesn’t matter if you take red or yellow. Just don’t get lost.

Leg 3

The fastest time was run by Jim Mann with 44.7 minutes.
The median time was 63.2 minutes.
This is a leg involving a bit of road running.

In the first half of the leg there are again three options. Basically, the question is how badly you want to avoid the road. Green is going around the mountain following the road (14 runners). Then, we have yellow (37 runners), which involves following a path up the mountain. Finally, red (16 runners) starts like yellow but sticks to the straight line.

For me the green (average 9.1%) is the slowest option, while yellow (8.2%) and red (8.5%) are more or less equivalent. Remarkable enough the fastest runners have systematically taken an option that I consider suboptimal. This is probably the only leg where this happens.
The leg is not over yet and more choices are to be made.

Most runners (61) followed the road until it makes no sense any more (green). A few (6), on the other hand, tried to keep up the straight line for the start of the stage (red). Finally, one runner tried something in between (yellow).

Not very convincing for me. It probably doesn’t really matter.

Leg 4

The fastest time was run by Jasmin Paris and Jim Mann with 20.9 minutes.
The median time was 31.4 minutes.
Here, you follow a very wide ridge before heading down to the checkpoint in the valley.

The big chunck (50 runners) followed the green band. The red line (9 runners) goes to the first summit, where there is no checkpoint, and makes there a turn instead of turning more gently. Runners following the yellow line (4 runners) started along the green band, but went a bit further to the north in the second half of the stage, where de red runners passed. Finally, 4 runners followed a line a little further to the south (cyan).

Unsurprisingly, hard to tell any differences from this.

Leg 5

The times of checkpoint 5 are not available. The fastest time over legs 5 and 6 combined was run by Jim Mann with 76.3 minutes.
The median time was 123.0 minutes.
I will use in the discussion of both legs 5 and 6 the time run between CP4 and CP6. The first question for this leg is how you get to the other side of the mountain to the east of CP4.

One option is to go all the way around by descending to the road and add a lot of road running (cyan, 13 runners). All the other options are heading straight over the mountain. The central yellow line was followed by 34 runners. Six runners made a turn to the east before heading south to the road (red). Finally, the green option (14 runners) is slightly more to the west than the main yellow line.

Clearly, cyan and red are not exactly fast options. I would avoid those if I were you. Between yellow and green it doesn’t really matter. Both appear to be about equally fast.
This brings us not yet to checkpoint 5. To get there we need to get to the summit of Esgair Penygareg from that road.

There are multiple options that I devided into three groups. The first option (red, 39 runners) is following the road until you get as close to the summit as possible and climb from there. The yellow group are 21 runners that were a bit less patient and left the road earlier. Finally, there is green group (7 runners) that absolutely disliked the road and simply went cross country.

This is another place where the faster half and the slower half act entirely differently. Green and yellow are for the faster runners, while the slower runners all opt for red. The most remarkable is the strong performance of green. I think that I will test that a next time. It is certainly not slow and allows you to avoid a huge stretch of road running. But some more data on that option would be great.

Leg 6

This leg is leading up to the halfway checkpoint. From CP5 you basically have to get to the other side of a mountain. The obvious question is which side of the mountain you should take.

There are a lot of options. Firstly, you can go to the eastern side. Even there you have plenty of choices. The most obvious path (red) was followed by 18 runners. Some thought it better to take a slightly shorter turn (yellow, 9 runners) or a much shorter turn (green, 9 runners). Then, there are those that passed on the western side. Of those, 11 runners crossed over to the path taken by the previously mentioned runners by following a path on the south side of the mountain (cyan). Others (19 runners, blue) sticked better to their choice and went in a more straight line. Finally, one runner (magenta) did something that is probably most adequately described as getting horribly lost.

Well, the least we can say is that the result is colourful. It is also remarkable that none of the options is reserved for faster or slower runners. And there is no clear winner. But remember that I’ve put the times over legs 5 and 6 together over this stretch. This part of the analysis will certainly benefit enormously from determining the times for both legs separately.

Leg 7

The fastest time was run by Jasmin Paris with 15.0 minutes.
The median time was 33.8 minutes.
Remember that this is the leg following the halfway checkpoint and as such includes time spent in the aid station. The leg is too short to be interesting.

Leg 8

The fastest time was run by Konrad Rawlik with 98.8 minutes.
The median time was 147.1 minutes.
The first part of this leg is not very interesting because you simply have to follow an obvious path. The second half is more interesting.

There are a few distinct possibilities. The most popular one is following the path to more or less the col and turn rather straight west to the summit with the checkpoints. There are to distinct turning points. There is the one of yellow (16 runners) and a bit further south the green one (34 runners). Some runners (3, cyan) apparently went a bit to far south before turning. Finally, there are 14 runners who risked going more cross country (red).

Well, this is a surprise for me. The fastest way is clearly also the shortest. The average percentages for the different options are 17.0% (red), 19.2% (yellow), 18.9% (green) and 21.2% (cyan). This is one of the places where the less obvious choice is faster. There is about 10 minutes to be gained at this point. As for the difference between yellow and green, you shouldn’t bother. It is something that we’ve seen a few times. The difference between making a turn just right or slightly earlier or later is not something that will break or make your race.

Leg 9

The fastest time was run by Jasmin Paris with 138.2 minutes.
The median time was 231.8 minutes.
This is a very long leg to the finish line. It is one of my least favorite because it involves a lot of road running (even though I’m rather able to do that as I ran the sixth time of this leg). But leaving CP8 there is an interesting choice to be made.

A first option is to head south, find a valley, at some point descend into the valley and start following the path that is there (red, 9 runners). The others left CP8 to the SW and went for the corner of the forest. After the forest there are again two options. The majority followed to road to join up with the red runners (green, 44 runners). The alternative is cyan (11 runners) which is certainly longer but involves less elevation change and probably a smoother running surface. Basically, it leaves out a small pass the the others have to tackle before hitting the lake. Finally, there are yellow (2 runners) which involves starting SW before switching to the red line and one runner who strayed a bit before finding the forest corner (blue).

What we see is that is once again doesn’t really matter. Cyan looks slow to me, but between red and green… There is no telling. I’m also a bit surprised by the good performance of yellow. That is another choice where I would love to see more data.

Overview
Day 1
Day 2
Day 3
Day 5

Posted in Lopen, Ultra | Leave a comment

How to kill a dragon? Day 3

Day 3 of the Dragon’s Back Race is less mountainous than the previous two stages. In distance, however, it is the longest stage of the entire race.

The entire stage

The fastest time was run by Jim Mann with 552.1 minutes.
The median time was 812.8 minutes.
Below are the histograms of the percentage spent over each leg.

By far the longest leg is the last one, where the runners spend close to 20% of the entire stage. Like for the previous two stages, I provide a scatterplot

My basic assumption that the percentage is independent of running time looks rather OK here. A quick look on the error bars for the slopes of the regression lines should confirm that.

Hmmm, not really very good. There is certainly a dependence in some of the stages, but it turns a bit in different directions. You remember that there is a correlation between the different percentages, don’t you? Even though the data don’t support my assumption, I’ll maintain it for the moment. We’ll see if a correction would be necessary at some point. Part of the explanation for the last leg is that slower runners get to run that (partly) in the dark, which obviously will slow them down.

Just as for stages 1 and 2, I made a set of boxplots. This is mine.

You see clearly where I had bad patches and made stupid mistakes. Again, they are for all runners available in a zip file.

Leg 1

The fastest time was run by Jasmin Paris with 64.7 minutes.
The median time was 88.6 minutes.
During this stage the runners climb Gau Graig. The general line is clear, but there is no path, so the details change a lot. Firstly, you should find the way up the mountain. Some runners clearly made a bad turn. One even managed to find an alternative route leaving the village.

The red ones (5 runners) are those that did an out and back or went over the alternative line through the village.

We clearly see that following a red line is not exactly helpfull, without being desastrous.

Once in access land, runners took multiple distinct lines. I tried to distinguish a bit.

The red ones (six runners) are those that went rather far east. Then we have a central group shown in yellow (42 runners). Finally, some went rather to the west (22 runners). Afterwards the lines join and split again, but we’ll consider that later.

Red is again not very interesting, but between yellow and green there is no real difference. Don’t worry too much and just keep the correct general direction.

I’ll try if I can make more distinctions by the way to approach the summit.

There are basically two popular lines. In the eastern line (red) there are 54 runners, while 16 went a bit more to the west (yellow).

Again, it doesn’t matter at all. It is just remarkable to see that that the faster runners opt for the more direct yellow line, while slower runners take the red line.

Leg 2

The fastest time was run by Jim Mann with 32.0 minutes.
The median time was 44.6 minutes.
It is basically following a ridge.

The major distinction is between runners that went to the intermediate summit (yellow, 25 runners) and those that contoured a bit south of the summit (green, 41 runners). Then, there are also a few that went rather far to the south (red, 4 runners).

There is not really a distinction. For the faster runners it looks like the green line is systematically faster than yellow. But maybe I’m reading to much into it now. Red is something you probably should avoid.

Leg 3

The fastest time was run by Charlie Sharpe with 50.0 minutes.
The median time was 70.2 minutes.
We continue the ridge running. The ridge makes here a wide turn, so the question becomes if you should follow it all the way or if you rather should descend a little and take a shorter way.

The blue runners (29) simply followed the ridge. Then, we have the cyan ones (19) that tried to take a little shortcut. The green runners (11) turned a bit earlier than the cyan ones and joined the yellow ones (8) that turned still earlier from the ridge. Finally, there were three runners that tried the red line, going very low.

Red is clearly a bad idea. Between the other colours, it is less clear. Not enough data, but personally I think that yellow looks rather promising. I’ll probably try that the next time.

Leg 4

The fastest time was run by Jim Mann with 40.7 minutes.
The median time was 65.3 minutes.
During this stage you leave the ridge and get into farmland. Most of the running in the farmland is along either an obvious or a mandatory route. The point where choices can be made is leaving checkpoint 3.

Most of the runners (52) went first a bit to the west before turning south (blue). Of those that started south, 13 turned quickly east (yellow) to join the blue line, while the other four runners get going south for a lot longer. Finally, one runner took a line to the west of all others (green).

Green and red are clearly bad ideas. Between yellow and blue, the most promising looks blue. It is certainly possible to mess it up (some did so), but the results are slightly better than those for yellow. As long as you don’t ask for p-values and such, that is. Just follow the logical line and everything will be fine.

Leg 5

The fastest time was run by Beth Pascall with 58.4 minutes.
The median time was 81.2 minutes.
Most of this leg is across farmland where you have no choice but following the road. The checkpoint is on the top of a mountain (surprise, almost all are) with different choices to get to the top.

Runners come from the west following a track and try to reach the checkpoint at the dot. A first option (green, 34 runners) is following the track to the saddle (or shortly before it) and then take a straight line to the summit. A second option is to leave the track a lot earlier and go again straight for the summit (yellow, 28 runners). This is done in a surprisingly narrow band even though there is no real path. Finally, some (8) runners took a line still further to the south (red). Those lines show a lot less clustering than the other colours.

What do we see? It doesn’t matter a thing. Possibly this is because this is just the end of the leg and the effect of how strongly you ran the rest of the leg is much more important.

Leg 6

The fastest time was run by Jim Mann with 45.0 minutes.
The median time was 64.7 minutes.
Basically, this is again following a ridge and at the end of the path turning left to the summit of a mountain. Halfway you pass a little minor summit where different options were taken and then there is variation in how you climb to the checkpoint. I will consider both parts separately.

Most (41) runners took the green line following the obvious path. Others (14 runners, cyan) sticked closely to the ridge and went over that little summit. Then there are the yellow (13 runners) and red (2 runners) lines. Those look suspiciously like following the wrong ridge, where the red runners even managed to get turned around in the fog.

Red is very bad. No surprise there. Yellow is also bad, but the interesting question betwee cyan and green is less clear. The averages are 8.0% for cyan against 8.1% for green, which basically means no difference.
Next, we look at the different options to climb to the checkpoint.

The main bulk of the runners (47, cyan) followed the obvious path. This is clearly the longest option. The red line are seven runners that turned a bit north and followed a line rather parallel to cyan before climbing to the summit. Two runners turned at the same point as the red line, but went then straight to the summit (green). Finally, the yellow line are 14 runners that started like cyan, but tried to shorten the wide turn.

This is rather clear. Follow cyan. It is the easiest way, you can’t get lost and it is the fastest. Red and green look rather desastrous, while yellow holds some promise but is a lot of effort for zero gain.

Leg 7

The fastest time was run by Beth Pascall with 50.5 minutes. She gained five minutes on anyone else.
The median time was 79.3 minutes.
This leg is a long descend to the halfway checkpoint. There are multiple tracks on the mountain and usually some people make terrible detours.

Most (59) runners took the straight cyan line down the hill. We see that some (6) strayed to the east and made an extra turn on an unsurfaced road to get back to the cyan line (yellow). Then there were two who did something similar to the west (green). Finally, three runners took a very long and original way far to the east of the others. There were some more very original tracks, but those belonged to people that did not finish the stage (usually they dropped at CP7), so those are not taken into account in this analysis.

It is no surprise that some of the original options take a very long time on this leg. More surprising to me is that some of the original options are still rather fast. It makes me wonder if the time you lose on this stage is not mainly due to doubting where you are. I know that is not always easy to pin your location down at every intersection. Possibly the most important thing is to keep going in a good direction while knowing where you are on the map. The time you can lose here doubting your position is probably a lot larger than what you lose by not exactly nailing the shortest way.

Leg 8

The fastest time was run by Beth Pascall with 33.1 minutes.
The median time was 55.8 minutes.
Keep again in mind that time include for this leg the time spent in the aid station. Variation in that resting time will probably dominate any difference due to route choices. Especially since this is a short leg of which most follows a mandatory route.

We see that the big majority (64 runners) to the straightforward option (cyan). Some (9) opted for a line parallel to the cyan line (green). And than there were three who tried the green line but did something that looks like getting lost (yellow).

Yellow is obviously bad. You don’t want to do that. Green? Well, not really bad. Some spent a long time, but others were as fast as the cyan ones. I suppose that the slower ones spent a long time trying to fit reality to the map.

Leg 9

The fastest time was run by Jim Mann with 20.1 minutes.
The median time was 30.2 minutes.
This is an obvious leg with no possibility to be original.

Leg 10

The fastest time was run by Jez Bragg with 106.2 minutes.
The median time was 152.7 minutes.
This is a long leg with choices to make in the first half and another choice in the second half.

In the first half the most popular option is to stay high (cyan). This option was chosen by 66 runners. A few tried something else. Usually this is descending a bit earlier than the cyan line and crossing part of the forest (yellow, 4 runners and green, 5 runners). Finally, one runner (Sabrina) was very original and went down immediately after CP9 and stayed low in the valley.

Well, this looks clear to me. Follow cyan. All the other options will make you lose (a lot of) time.

Then, we have the climb to the summit of Pumlumon Fawr where the checkpoint is.

There are multiple optios. A first option is to stay low and follow the valley. There is a small path to the east of the river. The yellow line follows this to the lake at the end of the valley and turns then west to climb to the summit (23 runners). Very similar is green, but those runners turned a bit earlier (11 runners). Then there are those that thought nothing of this path and started climbing the slope from the beginning of the valley. Most stayed level on the wide track, followed that through the valley an turned west at the end of the valley to climb to the summit (cyan, 8 runners). Other thought themselves to good for a track and went cross country over the slope in a somewhat straight line (blue, 33 runners). Finally, one runner (Christopher) was very original and chose a scenic tour to the east, adding in a few extra summits.

Here, it is funny to see how green and cyan are options for the faster runners, while yellow is restricted to slower runners. Blue on the other hand is popular among all. The average percentages are 18.5% (yellow), 18.5% (cyan), 19.1% (green) and 19.5% (blue). It is a close call, but I think that cyan is the preferable option. That is what I will try a next time. But yellow is also a very good option.

Leg 11

The fastest time was run by Damian Hall with 32.7 minutes. He gained almost five minutes on anyone else, which is surprisingly much for such a short leg.
The median time was 61.6 minutes.

If we look at the different options, we see that there are two distinct options. The yellow line (65 runners) cuts the corner a bit, while the red line (11 runners) sticks to the edge of the forest.

The difference in time is not much and the red option was only taken by back of the packers. It is probably simply due to night navigation and people running together or following each others lights.

Overview
Day 1
Day 2
Day 4
Day 5

Posted in Lopen, Ultra | 1 Comment

How to kill a dragon? Day 2

Day 2 of the Dragon’s Back Race starts with Cnicht and ends near Dolgellau. It was a very warm day.

The entire stage

The fastest time was run by Jim Mann with 480.8 minutes.
The median time was 804.8 minutes.
Below are the histograms of the percentage spent over each leg.

It is obvious that not all legs are created equal. Runners spend by far the longest on Leg 5. This leg takes about one third of the entire race. It also allows lots and lots of options, but we’ll get there later. My main assumption stays that percentage spent over each leg is constant over all runners. Let’s see how this assumption holds together in stage 2.

Not bad. Really not bad. I looks even better than in stage 1. To be sure, I also calculated the slopes of the regression lines.

Just like during day 1, the faster runners took a somewhat easy start. But contrary to day 1, the plots flat-lines very early. From the second leg on, you don’t see anything that clearly deviates from a flat line. The only exception is Leg 7 that appears to compensate a bit for Leg 1.

Just as for stage 1, I made a set of boxplots. This is mine.

You see clearly where I had bad patches and made stupid mistakes. Again, they are for all runners available in a zip file.

Leg 1

The fastest time was run by Damian Hall with 56.3 minutes.
The median time was 82.9 minutes.
This is the climb up Cnicht.

There is a very logical option, but it has some variation. Basically, you run towards a shoulder to the east of the summit and at some point you turn towards the summit. The point where this turn is made and the line taken afterwards can vary somewhat. Most runners where on one of two more or less parallel lines. Those are shown in green (22 runners) and cyan (64 runners). Then, there are some less popular options. There were a few (6) runners, shown in blue, that did something that looks suspiciously like overshooting. But the real original ones turned earlier away from the path to approach Cnicht from another side. One runner (yellow) approached from the south, while two runners (red) make a big detour and approached the summit from the NE. This is what the usual scatterplot looks like:

From the plot, no obvious winner emerges. Also a statistical test does not give a winner. I think it doesn’t really matter. Personally, I would avoid the red and yellow options. Both don’t look very promising to me, and probably with more data we would be able to see a difference. You obviously should avoid backtracking, but between green and cyan… No, really doesn’t change a thing.

Leg 2

The fastest time was run by Jim Mann with 40.0 minutes.
The median time was 68.8 minutes.
Another leg with multiple very different options.

The most popular option is leaving the summit to the west and contouring around the edge of the valley. This is shown in cyan and was followed by 42 runners. Another very popular option (29 runners) is starting towards the NE and then turning south to the end of the valley. This is the green line. At first, this looks like a very long way. It is, but there is a rather obvious path that you follow (I ended up on it in 2013). Both of those have a variant where the runners took a wider turn around the valley. For cyan this variant is shown in blue (7 runners) en for green in yellow (14 runners). I found it remarkable that after joining, blue and yellow split and join again, where the choice at that point simply depends on how they left the checkpoint. Finally, a few runners (five) went across the valley. Obviously the shortest way, but it involves a lot more elevation change. What does the scatterplot tell us?

First of all, I am a bit surprised how fast green and yellow are. They look like enormous detours, but are in fact rather competitive options. Simply from the plot I would say that cyan looks the most promising. But all options give a surprisingly similar result. If we just calculate the averages, the order is cyan (7.8%), blue (8.1%), yellow (8.3%), green (8.5%), magenta (8.8%) and red (10.1%). If you like p-values, I can only give you a significant difference between cyan and both green and magenta. Otherwise, you’d have to ignore multiple testing corrections to have significance, but that really feels like cheating. My conclusion would be to start from Cnicht towards the east. If you don’t nail the contouring, it doesn’t really matter. If you find yourself on the path going north-east, don’t panic. It’s rather fast anyhow. But avoid going across the valley. It isn’t fast and it is hard work.

Leg 3

The fastest time was run by Jim Mann with 16.6 minutes.
The median time was 26.5 minutes.
This is just running the obvious path between both Moelwyns. No interesting route choices to discuss. That is what I thought at least.

To be clear, we run from the dot labelled 2CP2 to the one with label 2CP3. The other one is CP4, where we go afterwards. Some runners thought the straight line sounds too good to be true. The straight line is in cyan and was followed by 73 runners. Other options involve starting towards the east and turning south at some point. The green ones (10 runners) decided quickly that they were going east, while they wanted south and corrected quickly. Not so for the yellow (3 runners) and red (8 runners). They made a huge loop to the east, where the yellow ones even passed checkpoint 4 before heading up to CP3.

This looks rather clear. Anything that is not the straight line gets punished. So, when you are standing on the first Moelwyn, take a look at your compass and make sure that you go in the right direction.

Leg 4

The fastest time was run by Jim Mann with 6.1 minutes.
The median time was 12.0 minutes.
This is another very short leg, but two options are visible.

The first option is to backtrack along the path towards the saddle and turn right towards the reservoir. Those are shown in yellow (34 runners) and green (49 runners). The distinction is that the yellow ones turned a bit earlier. Keep in mind that here the distinction could on occasions be influenced by a limited number of track points. The second (red, 10 runners) option is starting to the east and following a rather straight line ignoring the main path.

The red line is the fastest option and you can get a decent p-value if you would like to. The caveat is that the runners that took the shortcut are clearly the faster runners, so I lean heavily on the assumption that the percentage should be independent of running speed. In any case, my conclusion is that you shouldn’t stick to the path for too long, but aim for a direct line.

Leg 5

The fastest time was run by Jim Mann with 147.6 minutes. It is worth noting that Jim was here more than 15 minutes faster than anyone else.
The median time was 243.9 minutes.
This leg is one of the big mysteries of the Dragon’s Back Race. It is very long and offers a huge amount of options. Some are fast and long, others are shorter but slower. Nobody really knows what gets you the quickest to the support point. When looking at the tracks, a huge number of options is visible. I tried to get some structure in them. To do that, I separately look at different parts of the stage. Let’s start with how one gets down from the Moelwyns.

Most runners took the logical option of descending to the railway tracks and followed the valley to the south. To distinct options are visible: all the way at the bottom (yellow, 44 runners) or on the path a bit higher on the slope (green, 43 runners). A few took a really distinct option. Two runners in red went to the north to Tan-y-grisiau and started some road running. Finally, three runners took a straight line south instead of dropping into the valley (cyan).

First surprise, the red option is really quick. It is certainly longer, but the running must be very easy. The cyan line also looks promising. I’d love to see some more data on that option. As for the difference between green and yellow, the average over yellow is 29.4% against 30.7%. Testing significance gives a p-value of 0.012. It looks like yellow is effectively faster than green.

The following part of this stage that I will consider is how the runners entered and crossed the valley of the Afon Dwyryd.

We see many distinct options. First of all, there are those that went straight south from CP4. Those are now shown in magenta (they were cyan on the previous map). Then, we take a look how the big pack splits up. There are those that went to the east to cross the rivers using some bridges that are there (red, 21 runners). Most went rather straight south. The obvious line is green (36 runners), while a few strayed to the east (yellow, 10 runners). Finally, there are those who stayed closer to the railroad. Of those the blue ones (17 runners) took a bit of a shortcut, while the cyan runners (10) went around, closely following the railroad.

Well, this is a bit of a mixed bag. Visually, I would say that green and red look better than blue and cyan. For yellow the picture is really mixed and magenta is still something that needs more data. Using Holm, you get p-values < 0.05 for cyan and blue versus all the others. Conclusion for me, you shouldn’t take those two. All the rest, I don’t really know.

Then we have the big question. How do you cross the big emptiness that follows?

A popular option is to run all the way around the reservoir (red, 37 runners). That is quick running but a long way around. Others started similar, but crossed over to the dam (yellow, 5 runners). Then, we have those that went to Maentwrog, where the pack splits. Some (12 runners) took the green line to the SE, while most (37 runners) took the cyan line to the SW.

This really doesn’t say a thing. It is not with this choice that you will make the difference.

Now that we know how we start the big empty part, let’s try to classify the myriad of options.

We recognise again the tour around the reservoir (red, 37 runners). Then, we have those that took the other side of the reservoir. This implies crossing the dam and following the wide path following the reservoir (yellow, 10 runners). The green line are runners that went to the dam and crossed towards Moel y Gyrafolen (green, 4 runners). The cyan lines are runners that went straight to the saddle (8 runners). Further to the west we have the blue lines with runners that went to Llyn Eiddew Mawr (28 runners), while even further to the west we have a purple line (5 runners).

Well, there is no magic bullet. Red and yellow are fast and low-risk options. If you don’t mind road running or are bad at navigating that is probably what you should do. For the others it is less clear. Green? Doesn’t look that promising… Cyan? More or less the same. Blue? Huge variability. It can be very good or very bad. Probably worth a try if you are confident in your navigation. Magenta? A bit mixed. It can be very good. Certainly an option to keep in mind. What is the best option? Really, I still don’t have the answer.

Leg 6

The fastest time was run by Jim Mann with 50.1 minutes. He gained again five minutes on anyone else.
The median time was 89.8 minutes.
The time in the leg will include the time spent in the halfway point. Keep this in mind when looking at the results for this leg. The start is obvious. You follow the path to the Roman steps. More interesting is how runners approached Rhinog Fawr

Most runners took the path and turned SW when there was a path going that way (red, 58 runners). Some were less patient and turned a bit earlier (yellow, 13 runners). But the most interesting to me was the green line (21 runners) that is a rather straight line. I even never considered that one.

Interesting. All options appear possibly good, with maybe green being the best option. The averages for each are 11.0% (red), 11.3% (yellow) and 10.3% (green). If you want p-values you get 0.01 for green against the rest (using Holm adjustment). The next time, I think that I’ll give green a try.

Also in the last part to the summit there are different options.

The most popular is a rather straight line (yellow, 40 runners), closely followed by a loop to the west (green, 38 runners). Then, there is an even wider loop that was taken by 13 runners (cyan). Finally, one runner was original and approached the summit from the east instead of the west (red).

The conclusion is that is doesn’t matter a thing. Even the red option is perfectly fine.

Leg 7

The fastest time was run by Jim Mann with 44.2 minutes.
The median time was 85.4 minutes.
This is crossing from Rhinog Fawr to Rhinog Fach. This is another place where many options are possible. I’ll split it into two parts. Firstly, the options to descend Rhinog Fawr and secondly the options to climb Rhinog Fach.

To come down most (59) runners followed the yellow line. Where that line turns, some (12) went straight following the blue line. Others went even further east to find their way down (red, 6 runners). Looking to the west of the yellow line we see a green line with 6 runners and a cyan line with 9 runners.

Again not very clear. The averages are 10.6% (red), 10.5% (yellow), 10.6% (green), 11.2% (cyan) and 10.8% (blue). All very close together. I probably would avoid cyan, but otherwise you can pick anything you like.

Climbing Rhinog Fach allows for even more options.

To the east we have an approach from the NE (red, 8 runners). Then, there is a rather straight line with an approach from the north (yellow, 17 runners). All others entered the valley to the west of Rhinog Fach. There they climbed the west face of the mountain following the green (7 runners), cyan (35 runners) or blue (2 runners) lines. Some went even past the summit to climb it from the south (magenta, 15 runners). Finally, there is black, which is basically magenta with a somewhat shorter turn in the end (8 runners).

There is no clear winner, but visually I would say that cyan and red are the most promising options. The only one that looks really bad is blue, but that are only two slower runners together. The means and a 95%-confidence interval for the different colours are 10.0% (red, 9.7-10.3%), 10.8% (yellow, 10.5-11.1%), 10.9% (green, 9.8-12.1%), 10.2% (cyan, 9.9-10.4%), 11.3% (magenta, 10.7-12.0%) and 10.9% (black, 10.4-11.4%). I would probably go for red as that has the lowest variance.

Leg 8

The fastest time was run by Jim Mann with 20.4 minutes.
The median time was 39.3 minutes.
This is simply following a ridge. At least, that is what I tought.

Apparently we can argue which side of the lake is the best to take. Nine runners decided that going to the west would be best (yellow), while 81 went to the east (red).

The argument can stop right here. The red line is the best one. No doubt about that.

Leg 9

The fastest time was run by Jim Mann with 23.4 minutes.
The median time was 40.6 minutes.
During this stage you also follow the ridgeline, but it is a bit more subtle. The ridge turns a bit and has some intermediate summits. Should you stick to ridge or go a little lower?

I identified three major bands: eastmost and highest yellow (25 runners), somewhat lower and to the west green (24 runners) and still lower and further westward cyan (39 runners). There are some particular cases that I identified separately. The first one are two runners (Iestyn and Lloyd) that started to follow a wrong ridge (red). The blue line is someone (Joe Faulkner) who went very deep. And finally someone (Filip, magenta) thought it would be good to run past the summit and approach the checkpoint from the south (the backtracking is not on the map above).

There is zero difference between the three bands. Pick anything you want, it won’t make you faster or slower. Getting lost is bad, which probably surprises nobody and also magenta is not very good. I’m a bit surprised by the good score of Joe in blue. He might be onto something.

Leg 10

The fastest time was run by Jasmin Paris with 73.2 minutes.
The median time was 126.3 minutes.
Here you run down from the last checkpoint. Once you get in the valley there is a mandatory route to follow. So, we are only interested in the different possibilities to get down.

The most straightforward way is to backtrack a little after the checkpoint and follow a path that leads down (red, 68 runners). Staying on that path is clearly less obvious than it sounds because 19 runners strayed from it (yellow). And then we have some that tried to be original by continuing south after the summit. Two went straight south (green), while three runners started even SW, before turning in the right direction following some paths (cyan).

Clearly, you should stay on the path. Yellow is slower than red. The biggest victims of the straying were Damian Hall and André Jonsson. The cyan option doesn’t look any good either. Green then? Well, one dot looks terrible and one dot looks great. The one that looks terrible is the one who took a somewhat straight line SE. The going there is terrible, which makes that option very slow. I know because it’s me. The fast green line heads more south before disappearing from the map. This is a runner who continued to the road and followed the road instead of the mandatory route parallel to it. You should not consider this option, which makes green something to avoid.

Overview
Day 1
Day 3
Day 4
Day 5

Posted in Algemeen | Leave a comment

How to kill a dragon? Day 1

Day 1 of the Dragon’s Back Race started in Conwy Castle and finished south of Yr Wyddfa after a crossing of Snowdonia including the Welsh 3000ers.

The entire stage

The fastest time was run by Jim Mann with 470.0 minutes.
The median time was 747.4 minutes.
Below are the histograms of the percentage spent over each leg. In this stage the legs are numerous and short, which means that most of the time the spread of the percentages is minor.

My main assumption was that percentage spent over each leg is constant over all runners. Let’s see how this assumption holds together.

Over the first legs, the assumption is obviously not correct. Just visually you can see that this is not a flat line. To make this a bit more precise, I calculated the slopes of the linear regression lines for each of those stages. If this slope is zero, we have a flat line and the assumption holds. Otherwise the assumption doesn’t hold.

Faster runners tend to spend a higher percentage of their stage time to cover those legs. Otherwise said: the fast guns take is relatively slow at the start. Or another way to put things: they slow less down towards the end. But once we arrive at leg 6-7 the plot effectively flat-lines and my assumption looks more or less correct. Apart from those first stages I assumed that percentage of the stage would be a good measure to obtain the effect. In those first stages the route was rather obvious, so I don’t really care about those.

Another way of looking at this, is seeing over which parts you were flying and, conversely, where you had a rough time. For this I made a boxplot in which you can see my position with respect to the rest. The stages where the red dot is on the low end of the box, I was running strongly, while when the red dot is higher than the box, I was suffering (or making some bad mistakes).

Because the sum of all percentages must evidently be 100%, everybody will have legs where he is low and other legs where he is high. As a comparison, I also added the boxplot showing Jim Mann.

You probably are more interested in your own data. So, the plots for all runners are available in a zip file.

One runner is listed in the race results as a finisher, but with intermediate times that suggest he dropped halfway. I ignored this runner in the analysis. Also keep in mind that I only consider people that finished the stage. This excludes notably Pavel. A total of 120 runners are considered in the analysis on this page.

Leg 1

The fastest time was run by Jasmin Paris with 17.7 minutes.
The median time was 22.5 minutes.
Everyone took the obvious way.

Leg 2

The fastest time was run by Jim Mann with 7.0 minutes.
The median time was 10.1 minutes.
Probably there were some minor variations, but the tracks are not precise enough to distinguish them.

Leg 3

The fastest time was run by Jim Mann with 36.8 minutes.
The median time was 53.3 minutes.
Everyone took the obvious way, except for a few people that strayed too far east. It is not very interesting, but to get started let’s take a look into that. It will give an idea of what you can expect for the other legs and other stages. This is what the tracks look like.

Runners come from the north. Most follow the same line (yellow), but we see that a few (3 runners) are further to the east (red).

We see that the red dots are on the high side. This means that those runners were on the slow side on this leg. The conclusion is that this is no sound plan and you probably should follow the straight line like all the rest. You probably are not very surprised by that result.

Leg 4

The fastest time was run by André Jonsson with 36.0 minutes.
The median time was 53.4 minutes.
Everyone took the obvious way, except for someone (Filip) who strayed north.

The red line is clearly different from the others. But when we look at the percentages needed for this leg we find a surprise.

It was certainly not slower than the other runners. It looks a lot longer, so this surprises me. In fact I wonder if it are not simply some values where the GPS had a bad reception for some reason. It is always dangerous to draw conclusions from a single runner.

Leg 5

The fastest time was run by André Jonsson with 15.3 minutes.
The median time was 23.2 minutes.
Everyone took the obvious way.

Leg 6

The fastest time was run by André Jonsson with 8.5 minutes.
The median time was 13.5 minutes.
Everyone took the obvious way.

Leg 7

The fastest time was run by Edward Catmur with 8.2 minutes.
The median time was 12.8 minutes.
Everyone took the obvious way, except for André Jonsson. He started along the NW ridge, before backtracking and continuing along the correct ridge. It is worth remarking that he spent 23.3 minutes on this leg, against 9.2 for Jim. Knowing that he came second at the finish, only 11 minutes behind Jim, it looks like he lost the stage at this point. It is of course hard to say how race dynamics would have changed, but this was probably the most decisive moment of the race. Here, a two minute lag became a sixteen minute gap.

Leg 8

The fastest time was run by André Jonsson with 12.5 minutes.
The median time was 20.2 minutes.
Everyone took the obvious way. Except a few people that started along the eastern ridge before correcting towards the south.

It is a bad plan. Seriously. Just keep an eye on your compass when running in the fog, will you.

Especially the yellow line is bad. It takes about twice as long as the obvious green line. The most notable victim of this error was Alexander Beaven.

Leg 9

The fastest time was run by André Jonsson with 20.1 minutes.
The median time was 34.9 minutes.
Everyone took the obvious way. Again, there were some that started east before finding the correct ridge. Unsurprisingly, they lost time.

Leg 10

The fastest time was run by Jim Mann with 10.2 minutes.
The median time was 17.2 minutes.
Everyone took the obvious way.

Leg 11

The fastest time was run by André Jonsson with 23.0 minutes.
The median time was 44.6 minutes.
This is the point where things get interesting. During this leg, you run from the top of Pen Yr Ole Wen to the support point. There are two obvious options. Either you descend along the eastern ridge and go around the east side of the lake, or you take the southern ridge and go around the western edge of the lake. The latter option is shorter, but the first one provides faster running.

The eastern option (red) was the most popular with 84 runners taking it. Along the western tip of the lake came only 34 runners. Of those 34, there are two (yellow) that made a strange loop. It looks as if they were lost, but I have no idea if that is what actually happened. For those going to the west we see that there are two rather distinct lines. The easternmost one (green) was followed by 9 runners, while 23 runners went a bit more to the west (cyan). Now we all wonder what is the fastest option. Let’s see what we get when we plot the percentage of the time spent on this leg.

Interesting. The points of the western option appear to be systematically higher than the points of the eastern option. Indeed, if you run an ordinary t-test, you get a significant difference with a p-value of 0.000004. People choosing east spent on the average 5.8% of the stage on this leg against 6.5% for those going west. That is a difference of 3-4 minutes for the fastest runners and twice that for the slowest ones. My advice is obvious: take west. I’ll take east and gain a few minutes on you.
Then, is there a difference between both western options? The average for the green option is 6.3%, against 6.6% for the cyan option. But if you calculate a p-value, you get 0.26. That is rather bad, so I wouldn’t conclude that one is better than the other.

Leg 12

The fastest time was run by Jasmin Paris with 36.0 minutes.
The median time was 62.0 minutes.
One thing to keep in mind is that this is the leg following the support point. Time spent in the support point will be included in this stage time. My assumption is that this doesn’t matter for our analysis, but I’m not entirely sure about that.

I thought the route was obvious. You just follow the path a while and then turn left and head straight for the summit of Tryfan (blue). This is what most (84) people did. But there are some original choices. Some people (21) started south before turning a little SW and joining the main group (green). Then, there were some (7) that went too far along the path to the SW before turning towards Tryfan (cyan). A few runners (5) didn’t care about paths and went straight to the summit of Tryfan (yellow). And finally, one runner approached Tryfan from the north instead of the west (red). A lot of options and of course we would like to know which one is the best.

Well, this is less clear than what we had at the previous leg. I can tell that you are not getting any significant differences out of this. Even without adjustment for multiple testing (aka sherry picking) only one of the differences is significant. We can not get any strong conclusions from that. From the plot, I would say that the green option looks the most promising. I think I’ll try to find that one next time I run there. Finally, I’m a bit surprised how fast the red approach from the north is. OK, one data point is not very much, but it looks an awful long way on the map. André (who took that option) was only three minutes slower than Jim. Which might or might not be explained by a difference in time spent in the aid station. I’d love to see some more data on that option.

Leg 13

The fastest time was run by Steve Birkinshaw with 34.3 minutes.
The median time was 55.2 minutes.
You have to stay on the correct ridge. Some people didn’t. Blame it on the fog.

The line that was followed by most (101) runners is shown in cyan. An alternative (red) was chosen by four runners. It involves going a bit to the east. I’m honestly not sure if this is the line they actually run or if it is just an artefact of GPS reception. Then, we have the green line, which involves following the ridge to get to the Glyders, instead of going a bit around. This was done by five runners. Finally, there is the yellow line that looks suspiciously like getting seriously lost on the wrong ridge. Eight runners found themselves in that boat.

The picture is rather clear. Red and cyan are fine, green and yellow are slow. The notable victims of the green line are André Jonsson and Jez Bragg. This is the leg where André finally lost the stage. He lost here another nine minutes on Jim.

Leg 14

The fastest time was run by Jim Mann with 15.2 minutes.
The median time was 25.3 minutes.
Everyone took the obvious ridge except for two runners who went too far south and had to make a right turn to find the summit (red line).

That is as bad as it sounds.

Leg 15

The fastest time was run by André Jonsson with 20.0 minutes.
The median time was 36.4 minutes.
This is another interesting leg. There are multiple options to descend to the Pen-y-Pass. You can see that a few lines were taken of which it is not immediately obvious which one would be the optimal one. I identified a few popular possibilities.

Most people went more or less south at first and after making the turn towards the Penn-y-Pass, three main lines are visible. Those are shown in yellow (29 runners), green (21 runners) and cyan (44 runners). Some people went a bit further south before turning towards the south-west, an option that is shown in blue (12 runners). Another possibility was coming straight down in a more or less straight line to the Penn-y-Pass (red, 12 runners). To be complete there was also someone who went straight for the road and then climbed to the Penn-y-Pass following the road. However, this runner dropped at the Penn-y-Pass, so I won’t consider this option in the analysis. This is what the plot looks like.

Lots of dots, lots of colours and no obvious winner or loser. The averages for the different options are 5.14% (red), 4.68% (yellow), 4.89% (green), 5.13% (cyan) and 4.93% (blue). The only two that are significantly different according to a pairwise t-test are yellow and cyan. All the rest, no, not really. But remember that this is one of the stages where the slope of the regression line was significant and we see that yellow is generally followed by faster runners than cyan. This makes it really troubling to obtain a meaningful conclusion. To conclude, we won’t draw any hard conclusions from it. According to me the most import thing is to pick a reasonable line and keep going. Just don’t start second-guessing your choice. Even if your choice is not the optimal one, differences with the other options are tiny and the influence of your own effort will dominate the differences.

Leg 16

The fastest time was run by André Jonsson with 40.5 minutes.
The median time was 70.3 minutes.
Everyone stayed on the rather obvious line or close to it.

Leg 17

The fastest time was run by André Jonsson with 22.7 minutes.
The median time was 42.5 minutes.
Here the obvious way is to follow the ridge again. There are paths a bit lower, but all options are too close to each other to make a distinction based on the tracks.

Leg 18

The fastest time was run by Jim Mann with 8.4 minutes.
The median time was 13.1 minutes.
Everyone took the obvious way. I have no idea what you would do otherwise.

Leg 19

The fastest time was run by Jim Mann with 23.4 minutes.
The median time was 46.5 minutes.
Some people went to fare south after the summit of Yr Wyddfa and had to backtrack to find the correct ridge.

It comes probably as no surprise to anyone that erring is not a sound plan.

Leg 20

The fastest time was run by Konrad Rawlik with 20.3 minutes.
The median time was 37.0 minutes.
Here, there are without a doubt different lines that can be taken, but they are all parallel and close together. The resolution of the tracks is not enough to distinguish them really. Some are probably better than others, but I can’t tell based on the tracks.

Leg 21

The fastest time was run by Edward Catmur with 17.7 minutes.
The median time was 33.3 minutes.
Again, there are certainly different lines, but it is very hard to distinguish them based on the tracking data. They are simply to close together. My main advise is to stay on that wide path once you found it. A few people went straight where it switchbacks down and those where rather slow.

Leg 22

The fastest time was run by André Jonsson with 5.0 minutes.
The median time was 9.4 minutes.
The leg is way too short to tell different options apart. I’m not even trying to.

Overview
Day 2
Day 3
Day 4
Day 5

Posted in Lopen, Ultra | 5 Comments

Nieuwsbrief mei 2016

Elk jaar opnieuw is mei een maand er eentje met verschillende verlengde weekends. Naar goede gewoonte blijf ik dan in geen geval thuis. Het eerste van die lange weekends was dit jaar met Hemelvaart. Met daar een paar dagen verlof aan te plakken vond ik dat ideaal om een paar dagen naar Iran te trekken. Iran is natuurlijk groot en zo lang ging ik daar niet blijven. Ik moest dus een keuze maken. Die viel uiteindelijk op Damavand, de hoogste berg van Iran met een hoogte van 5670 meter. Ik was van plan daar wat rond te trekken en afhankelijk van weer en sneeuw eens naar de top te klimmen.
De verplaatsing was eenvoudiger dan ik op voorhand verwacht had. Van de luchthaven ging het met de taxi naar het busstation, waar ik met een mengeling van Engels en hulpeloos kijken een ticket kon kopen. Direct was er een behulpzame ziel die dezelfde bus nam en zich over mij ontfermde. Zo geraakte ik vlotjes op de juiste bus en er op de juiste plaats ook terug af. Die juiste plaats was Polur. Je zit daar al op een goede tweeduizend meter hoogte en het is de poort tot Damavand. Er staat zelfs een standbeeld van een bergbeklimmer naar de top te wijzen.
In eerste instantie volgde ik er een weg die langsheen de flank van de berg slingert. Op een bepaald moment is er dan een pad omhoog. In de onderste stukken is het een onverhard baantje dat je beter niet volgt want het slingert gigantisch. Best ga je gewoon recht omhoog. Dat blijft zo tot je op ongeveer drieduizend meter hoogte aan een moskee komt. Die staat daar te blinken met gouden daken. Geen idee waarom. Ik kan me niet inbeelden dat ze heel veel volk trekt.
Na de moskee is er een mooi pad dat je zonder enig probleem kan volgen. Het is alleen behoorlijk steil en de hoogte begint zich ook te laten voelen. Toch zeker als je zoals mij een paar uur tevoren midden in de nacht geland bent.
Op de flank staat een berghut op 4200 meter hoogte. Dat wat op dat moment netjes de hoogte waar je in de sneeuw begon te komen. Het werd avond dus ik besloot er te overnachten. Op voorhand had ik niet echt een idee wat ik van een Iraanse berghut kon verwachten, maar het bleek erg gelijkaardig aan een Europese te zijn. Je vindt er een ruime eetzaal met lange tafels en een paar slaapzalen. De slaapzalen zijn ook op zijn Europees met rijen stapelbedden. Naast een paar Iraniërs zaten er vooral Russen en Duitsers.
Die eerste nacht in de hut sliep ik verbazend goed. Ik had gezien de hoogte verwacht dat het veel moeizamer zou zijn. De volgende ochtend was mijn rustpols gezakt tot zeventig. Op zeeniveau zou dat natuurlijk erg verontrustend hoog zijn, maar voor van zeeniveau recht naar meer dan vierduizend meter te trekken is het erg goed. Die dag blies een ijskoude stormwind om de hut. Bij het buiten komen kon ik me amper recht houden. Ik besloot een dagje in de hut te blijven. Daarmee hoopte ik een dag later wat beter weer te krijgen en scoorde ik een extra acclimatisatiedag.
Mijn gok bleek goed uit te draaien. De volgende ochtend was er een stralend blauwe lucht en amper een zuchtje wind. Perfect weer om naar de top te trekken. Dat deed dan ook quasi iedereen in de hut. De meesten trokken doorheen de sneeuw op ski’s omhoog. De anderen wandelden op crampons. Wat het vlotste ging hing wat af van de gekozen route. In stukken waar je diep wegzakte waren de skiërs sneller. Waar de sneeuw dan wat harder is, waren de wandelaars sneller omdat ze rechter omhoog kunnen.
Eens je in de buurt van de top komt liggen dan weer wat meer rotsen. Het is allemaal technisch helemaal niet moeilijk, maar gewoon heel erg steil en je begint daar de hoogte natuurlijk ook behoorlijk te voelen. Regelmatig ruik je daar ook een sterke zwavelgeur. De vulkanische oorsprong van de berg is daar natuurlijk de oorzaak van. Net onder de top passeerde ik zelfs een stoombron die de bronnetjes die ik afgelopen zomer in IJsland zag liet verbleken.
De top zelf is een besneeuwde vulkaankrater. Het was er vooral ijzig koud. Op die hoogte zijn de temperaturen niet bijster hoog en je staat er natuurlijk vol in de wind. Boven op het hoogste punt van het volledige Midden-Oosten had ik niets anders verwacht.
De afdaling ging dan weer erg gemakkelijk. Je kan de hele tijd blijven lopen. Eens op de sneeuwvelden was glijden zelfs nog sneller. Ik maakte me ook geen zorgen over de rotsen onderaan de sneeuwvelden. Met een ijsbijl kan je altijd wel stoppen als het nodig is. Nog voor de skiërs die samen met mij op de top stonden was ik terug aan de hut. Vanaf de hut besloot ik een doorsteek naar Polur te maken in plaats van het pad en de weg die ik gekomen was in de omgekeerde richting te volgen.
In die doorsteek zaten nog een paar lastige stukken. Het probleem was vooral dat ik voortdurend sneeuwvelden door moest, maar op die lagere hoogtes is de sneeuw behoorlijk zacht en zak je voortdurend diep weg. Op de steenvelden is het al niet veel beter. Die zijn zo steil dat je amper stabiel kan blijven staan. Van zodra je ergens je voet neerzet begint de hele helling te schuiven.
Tegen de avond zette ik mijn tent op in een totaal verlaten vallei op ongeveer drieduizend meter hoogte. Ze stond amper recht of het begon te regenen. In de loop van de nacht kreeg ik nog het plezier van storm, onweer en hagelbuien te mogen trotseren. De volgende ochtend trok ik dan verder naar Polur. Ik was van plan om daar de bus te nemen, maar dat is me nooit gelukt. Binnen de vijf minuten was er een Iraniër die naar Teheran reed en me een lift aanbood. Hij vond dat ik op Reinhold Messner leek. Ik had echt niet verwacht dat ze die tot in Iran zouden kennen.
Daarmee had ik nog een halve dag over om Teheran wat te verkennen. De stad is verrassend aangenaam. Natuurlijk zijn er negen miljoen inwoners, wat het nodige verkeer geeft. Maar er zijn verrassend veel mooie groene parken. In eentje zag ik zelfs een gemarkeerd looppad. Voor een toerist als mij is het ook behoorlijk toegankelijk. Bijvoorbeeld alle straatnaamborden zijn tweetalig Farsi en Engels. Ook de meeste andere opschriften zijn ook in het Engels vertaald. Dat maakt het een heel pak gemakkelijker om je weg te vinden dan wanneer je moet behelpen met alleen maar Arabische tekens die je totaal niet kan lezen.
Volgens mij gaat het toerisme in Iran de komende jaren een gigantische boom kennen. Het enige resterende obstakel is dat je alles cash moet meebrengen. Onze Westerse bankkaarten werken daar niet. Maar van zodra de Amerikanen wat normaler beginnen doen met hun economische sancties komt dat hopelijk ook in orde. Ik kan een bezoek aan Iran in elk geval van harte aanraden.

Naast het Hemelvaartweekend had je in mei ook nog het Pinksterweekend. Dat is ook een lang weekend dus had ik natuurlijk een vliegtuigticket liggen. Dat bracht me naar Bergamo. Voor mij is Bergamo een erg klassieke bestemming voor als ik niet direct veel inspiratie heb.
Zoals gewoonlijk trok ik met de trein verder naar Lecco vanwaar ik me een beetje kon amuseren op de bergen langs het Comomeer. Ik probeerde het zo technisch mogelijk te maken. Die Italianen hebben verschillende moeilijkheidsgraden en EEA is perfect voor mij. Die gemarkeerd met A zijn nog moeilijker, maar dat zijn meestal gewoon de paden die naar een klimwand leiden.
Erg veel afstand heb ik niet afgelegd. Die technische paden gaan niet bijster snel vooruit. Daarnaast slingerde ik gewoon doelloos omhoog en omlaag. Op tijd en stand stak ik er ook wat pauze tussen om gewoon van het uitzicht te genieten. De hele tijd was er een stralend blauwe lucht. Dat is veel te aangenaam om me dan veel te haasten.

Sindsdien heb ik geprobeerd om goed te trainen. Dat lukt niet bijster goed. Mijn achillespees is nog maar eens lastig aan het doen. Het lukt om wat te lopen, maar ik kom hoegenaamd niet aan de volumes die ik rond deze periode had willen trainen. Hopelijk komt daar snel beterschap in.

Posted in Nieuwsbrief | Leave a comment

Nieuwsbrief april 2016

Tijdens de afgelopen maand waren er twee uitstapjes waar ik kort iets over kan vertellen. Het eerste daarvan ging richting Mallorca. Zoals meestal ging ik daar gewoon een beetje rondzwerven. Vanuit Palma begon ik te lopen. De eerste uren ging dat prima. Net buiten de stad beginnen de bergen en ik vond zonder problemen een paar mooie paden. Maar na een paar uur kwam ik er toch achter dat grote delen van het eiland afgesloten zijn. Zeker als je een vallei moet doorsteken kom je soms tegen dat alle paden en wegjes met grote afsluitingen versperd zijn. Een groot deel van de paden op de kaart zijn in dergelijke gebieden natuurlijk nergens te bespeuren. Ik ben nog altijd kwaad dat ik op een bepaald moment meer dan tien kilometer heb moeten omlopen over een asfaltweg.
Gelukkig zijn er verschillende gemarkeerde wandelwegen en die zijn dan wel zonder problemen toegankelijk. Hoog genoeg in de bergen doe je natuurlijk ook totaal je zin. Ik vond een paar erg leuke technische stukken waar je behoorlijk over de rotsen moest klimmen. De bergen op het eiland zijn gewoon schitterend. Daar kan een trailer zich helemaal uitleven. De tweede helft van mijn tocht liep ik dan hoofdzakelijk over een GR. Dat heeft het voordeel dat je totaal niet verloren kan lopen, maar dikwijls zijn die paden wel erg goed onderhouden. Ze hebben de neiging om de paden zo breed en effen aan te leggen dat het niet leuk meer is.
Globaal heb ik een positieve indruk van het eiland gekregen, maar jammer dat je wat lokale kennis moet hebben om iets buiten de gemarkeerde paden te kunnen doen.

De week erna trok ik nog eens naar Engeland. Zoals wel vaker vloog ik naar Manchester vanwaar je erg snel in het Peak District staat. Ik gebruikte mijn klassieke startpunt Glossop om een toer van twee dagen te maken. In essentie vertrok ik eerst zuidwaarts, draaide wat in het rond in de buurt van Kinderscout en liep dan toch maar naar het noorden. Langs het Derwent Reservoir ging het dan met een grote boog naar Bleaklow Head om zo terug naar Glossop te lopen.
In Engeland ben je iets minder zeker van goed weer dan op Mallorca en dat heb ik goed gemerkt. De zon was er een pak minder en af en toe kreeg ik wat stofhagel over mij heen. Tegen de tijd dat ik een slaapplaats zocht kreeg ik dan nog een sneeuwbui op mijn kop. ‘s Morgens lag er nog een dun laagje sneeuw en mocht ik ook nog eens het klassieke probleem van de bevroren schoenen oplossen. Allemaal dingen waar ik mijn hand niet meer voor omdraai.
In vergelijking met vorige keren leek het Peak District me deze keer behoorlijk nat. Het is een beetje moeilijk vergelijken want al die Engelse gebergtes liggen gewoon vol met venen en moerassen allerhande. Maar mijn indruk was dat ik nu wat vaker en dieper wegzakte dan gewoonlijk. Op een bepaald moment verdween ik zelfs plots heupdiep in de modder. Het kostte me een paar angstige momenten en heel wat gespartel om daar terug uit te geraken.
Het Peak District blijft voor mij een onderschat gebied waar je van bij ons heel snel, goedkoop en gemakkelijk kan geraken.

Helemaal op het einde van de maand liep ik nog mee in La Bouillonnante. Het verwondert waarschijnlijk niemand dat die wedstrijd in Bouillon wordt gelopen. De afstand wisselt regelmatig. Dit jaar was het 72 kilometer die voorzien was. Wie de streek daar een beetje kent weet wel dat er daar meer dan genoeg mogelijkheden zijn om recht omhoog en omlaag op de flanken van de Semois te spelen. Voor mij was de wedstrijd gewoon een goede gelegenheid om eens met CEPAL op weekend te gaan en eens te testen hoe het met mijn vorm zit. Trainen doe ik wel maar af en toe heb je toch eens een wedstrijd nodig om echt te kunnen vergelijken. De grote onbekende was hoe mijn knie het zou houden. Ik slaagde er de voorbije tijd wel in om goed te trainen maar de gevolgen van de Aymon Trail in februari bleven toch sluimerend aanwezig.
De start om vijf uur ‘s morgens betekende erg vroeg opstaan. Bij de start vormden zich een paar kleine groepjes die bij elkaar in de buurt bleven hangen. Ik schat dat ik op mijn gemak zo ergens rond de tiende plaats liep. Eigenlijk bleef de wedstrijd erg gesloten zolang het donker was.
Eens het daglicht zich liet vormde zich toch een kopgroep bestaande uit Aaike, Baptiste, Nicola, Thomas en mij. Regelmatig nam iemand daar wat voorsprong of bleef een beetje achter, maar in essentie bleef het een groepje. Pas aan de tweede bevoorrading bleef Thomas wat achter en kwam niet meer terug. Een eind verder was het dan aan Aaike om wat achterop te blijven in een afdaling en niet meer terug bij de andere drie te geraken.
Daarna was het mijn beurt. De knie liet zich van in het begin een klein beetje voelen. Geen paniek, zo loop ik al een hele tijd. Maar nu werd dat toch geleidelijk wat erger, zodat ik toch mijn stap begon aan te passen, wat me dan weer last in de heup deed krijgen en uiteindelijk blokkeerde alles gewoon tijdens afdalingen. Op die manier gaat het natuurlijk niet bijster vlot en is vooral het risico om langdurige gevolgen te dragen behoorlijk groot. Ik had echt geen zin om mijn hele zomer in gevaar te brengen en wandelde gewoon naar de volgende bevoorrading waar ik uit de wedstrijd stapte.
De conclusie is vooral dat ik fysiek wel goed ben, zonder super te zijn, maar dat de knie op dit moment nog maar een halve Bouillonnnante verdraagt.

Posted in Nieuwsbrief | Leave a comment

Nieuwsbrief maart 2016

Geen wedstrijden in de loop van maart, maar toch twee weekends erop uit waar ik wat over kan vertellen.
Het eerste daarvan ging zuidwaarts naar Alicante. Die regio is vooral gekend voor de Costa’s. Het strand is natuurlijk niet direct waar ik me een heel weekend wil ophouden. Ik zocht dus wat bergen in de buurt van Alicante. Het kostte toch een beetje zoekwerk om een voldoende grote bergketen die dan ook nog wat bereikbaar is te vinden. De keuze viel uiteindelijk op Alcoy als vertrekpunt. Dat is een klein stadje met erg mooi historisch centrum aan de voet van de Serra de Mariola. De bergwanden rijzen op aan de stadsrand.
Eerst maakte ik een ruime lus naar het noorden want daar zitten de hoogste toppen. Het gebied is duidelijk erg populair voor daguitstapjes. Dat zorgt er ook voor dat er een uitgebreid netwerk van over het algemeen duidelijke paden is. Na mijn passage over de Montcabrer die met zijn 1389 meter hoogte de hoogste top van de Serra de Mariola is, probeerde ik eens een padloze doorsteek. Dat bleek niet zo’n super idee want alles zit daar natuurlijk vol met van die venijnig prikkende struikjes. Daarna volgde ik de kam aan de noordkant van de Serra. Eens je wat verder naar het westen komt verdwijnt het duidelijke pad. Je komt er een pak minder volk tegen en regelmatig moet je wat rondhuppelen over ruwe rotsen.
Aan het einde van de bergrug liep ik de Serra de Mariola uit. Daarna moest ik een wat vlakker stuk doorsteken om in de Serra del Maigmó te geraken. Gelukkig vond ik tussen de velden een paar mooie onverharde wegen. De Serra del Maigmó zelf viel een tikkeltje tegen. In grote stukken liep ik voortdurend tegen bordjes privaat en verboden toegang aan. Het zou kunnen dat die vooral bedoeld waren om gemotoriseerd verkeer buiten te houden, maar in streken die ik niet echt ken ben ik daar toch altijd een beetje voorzichtig mee. In essentie wordt je naar een onverharde weg doorheen de bergen gestuurd, waar alle mountainbikers en wandelaars op zitten.
Helemaal op het einde, tegen de rand van Elda vond ik dan gelukkig terug een paar leuke varianten met een paar mooi technische paden. Vanuit Elda keerde ik dan terug naar Alicante. De streek is niet heel spectaculair, maar er zijn toch een paar leuke massiefjes te vinden. Het grootste probleem is dat die niet altijd goed bereikbaar zijn met openbaar vervoer. Het openbaar vervoer is daar in de regio gewoon behoorlijk zwak uitgebouwd.

Tijdens het paasweekend ging ik dan een totaal andere richting uit. Dan trok ik westwaarts, naar Ierland. In Ierland was ik eerder wel al een paar keer, maar toen bleef ik steeds aan de oostelijke kant van het eiland hangen. Dit keer was mijn plan om eens naar het westen van het eiland te trekken. Ik gebruikte Killarney als uitvalsbasis. Het doel van het weekend was vooral om Carrauntoohil eens te beklimmen. Die is met zijn 1038 meter hoogte de hoogste top van Ierland. Tussen Killarney en Carrauntoohil ligt een groot meer waar ik helemaal rond moest. Volgens wat ze daar ter plaatse beweren is het meer wereldberoemd. Ik ben duidelijk geen man van de wereld want ik had er nog nooit van gehoord. Om er rond te geraken kon ik netjes de Kerry Way volgen. Dat is een mooie en prima gemarkeerde wandelroute. Daarmee kwam ik aan de zuidkant van de Macgillycuddy’s Reeks uit, waar je Carrauntoohil moet gaan zoeken.
Dat ik in Ierland was merkte ik het beste aan het weer. Ik kreeg afwisselend zon, wolken, regen en hagel. Soms allemaal tegelijk. En meestal allemaal binnen dezelfde vijf minuten.
De Macgillycuddy’s Reeks beklom ik via een meertje en dan verder naar de top van Maolán Buí. Waarschijnlijk is het niet de bedoeling dat je van die kant komt want ik moest een paar afsluitingen over springen. Eens ik op een zevenhonderd meter hoogte kwam liep ik door een dun laagje sneeuw. Absurd genoeg was dat minder glad dan het compleet met water verzadigde gras op lagere hoogte.
Eens ik op de top van Maolán Buí kon ik over de graat doorlopen via Cnoc an Chuillinn naar Carrauntoohil. Daar boven op de toppen kreeg ik natuurlijk de volle laag van de weergoden. Zeker het laatste stukje naar de top van Carrauntoohil kreeg ik nog een ware hagelstorm te verwerken. Het was zo eentje met van die snijdende hagelstenen die zelfs mij ervan overtuigde een lange broek aan te doen. Het zal waarschijnlijk niemand verwonderen dat ik op de top van Carrauntoohil niet veel meer gezien heb dan mist en hagelstenen. En het kruis dat op de top staat heb ik ook nog kunnen bespeuren.
Daarna bleef ik nog wat op en rond het massief routes verzinnen. Daarvoor heeft Macgillycuddy’s Reeks het probleem dat het wat te klein is. Je hebt alles vrij snel gezien en om door te steken naar een volgende massief moet je steeds door een vallei met boerderijen. Dat betekent vele afsluitingen waarvan het waarschijnlijk niet echt de bedoeling is dat je er overal begint over te kruipen. Voor kortere tochtjes is het gebied wel uitstekend geschikt.

Vorige maand rondde ik af met een knie die ik behoorlijk stevig gestoten had. Helemaal in orde is die nog altijd niet. Lopen gaat wel, maar vooral in steile afdalingen hindert het nog steeds. Dat is wat ik nu zo snel mogelijk probeer in orde te krijgen.

Als afsluiter geef ik nog een eerder administratieve mededeling mee. Velen onder jullie weten dat ik regelmatig wat foto’s op http://picasaweb.google.com/ptityeti plaats. Google heeft beslist om Picasa aan de kant te schuiven waardoor ik eens naar een andere oplossing heb gekeken. Sinds maart komen de nieuwe foto’s op Flickr, meer bepaald op https://www.flickr.com/photos/134992576@N02/. De oude albums blijven gewoon beschikbaar waar ze nu staan.

Posted in Nieuwsbrief | Leave a comment