Day 4 of the Dragon’s Back Race is for me the least interesting stage. It contains a rather big amount of road running, including a very long descent to reach the finish line.
The entire stage
The fastest time was run by Jim Mann with 478.8 minutes.
The median time was 767.3 minutes.
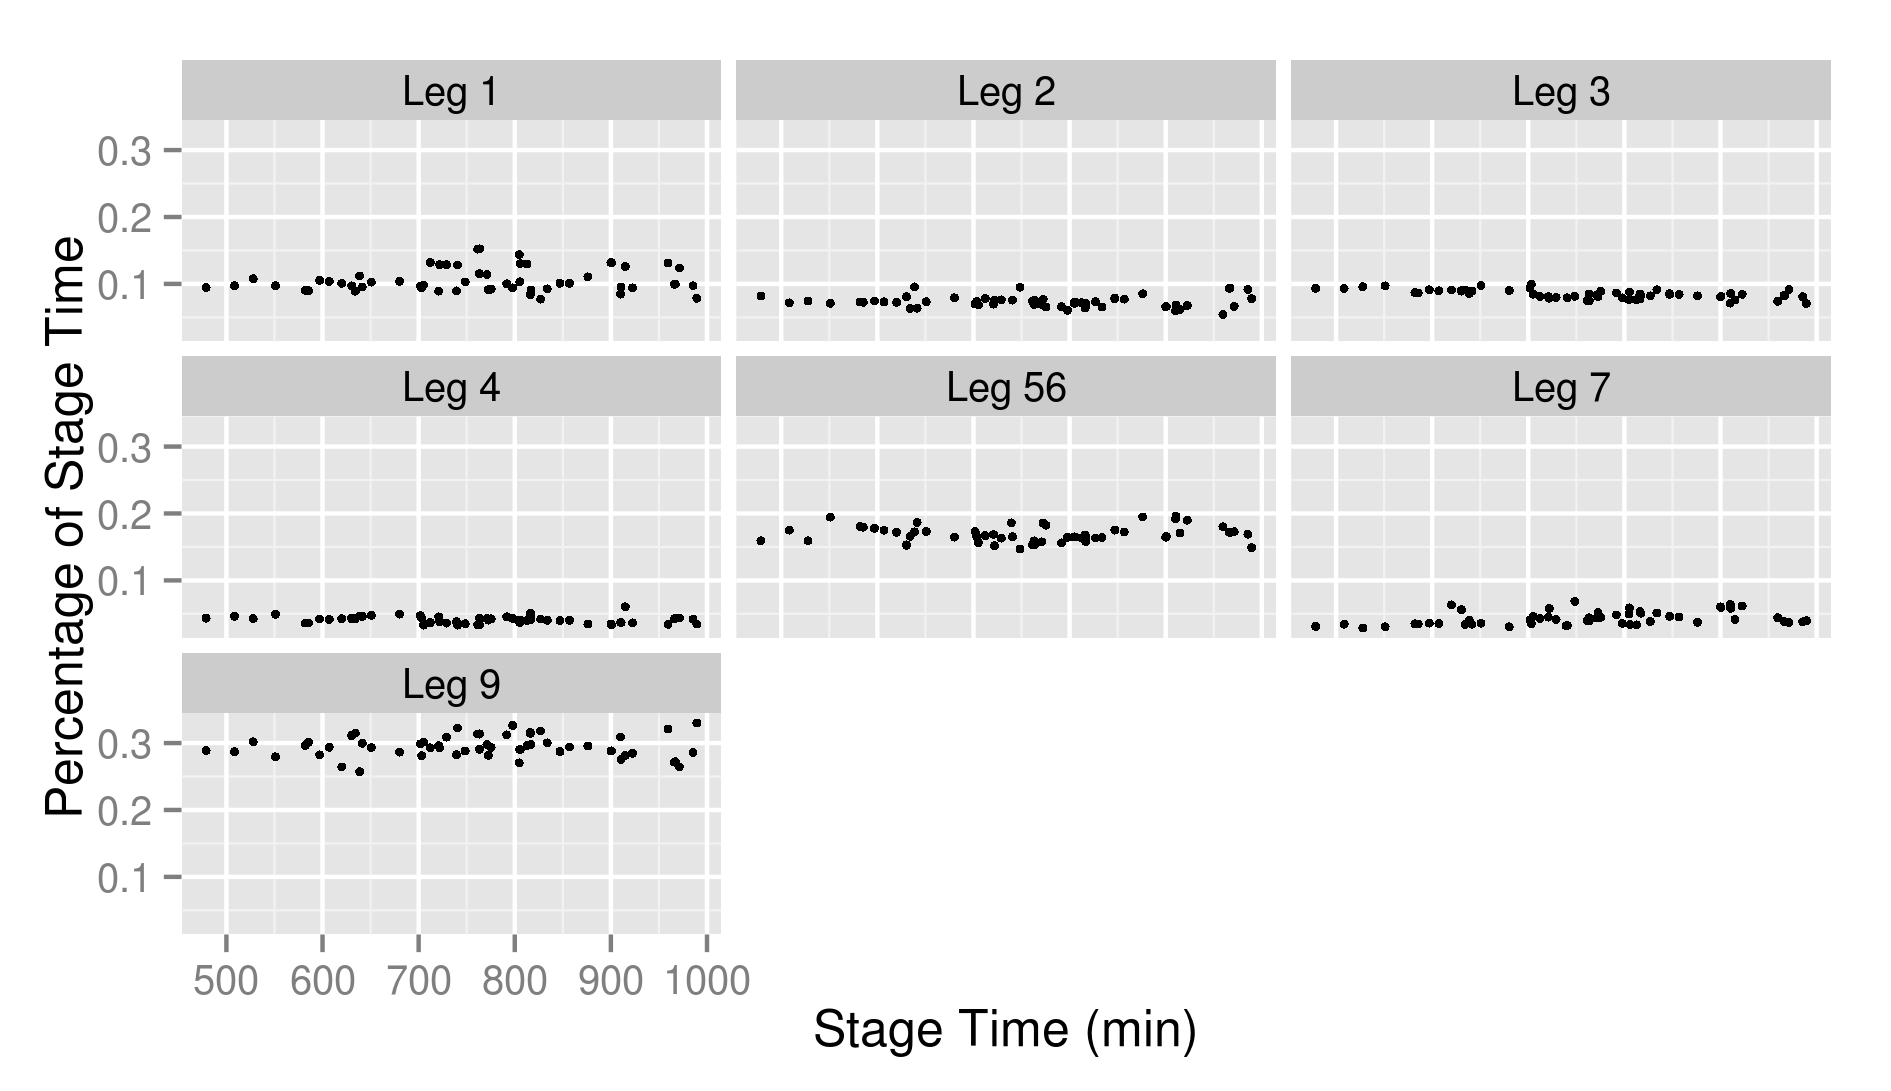
Below are the histograms of the percentage spent over each leg.

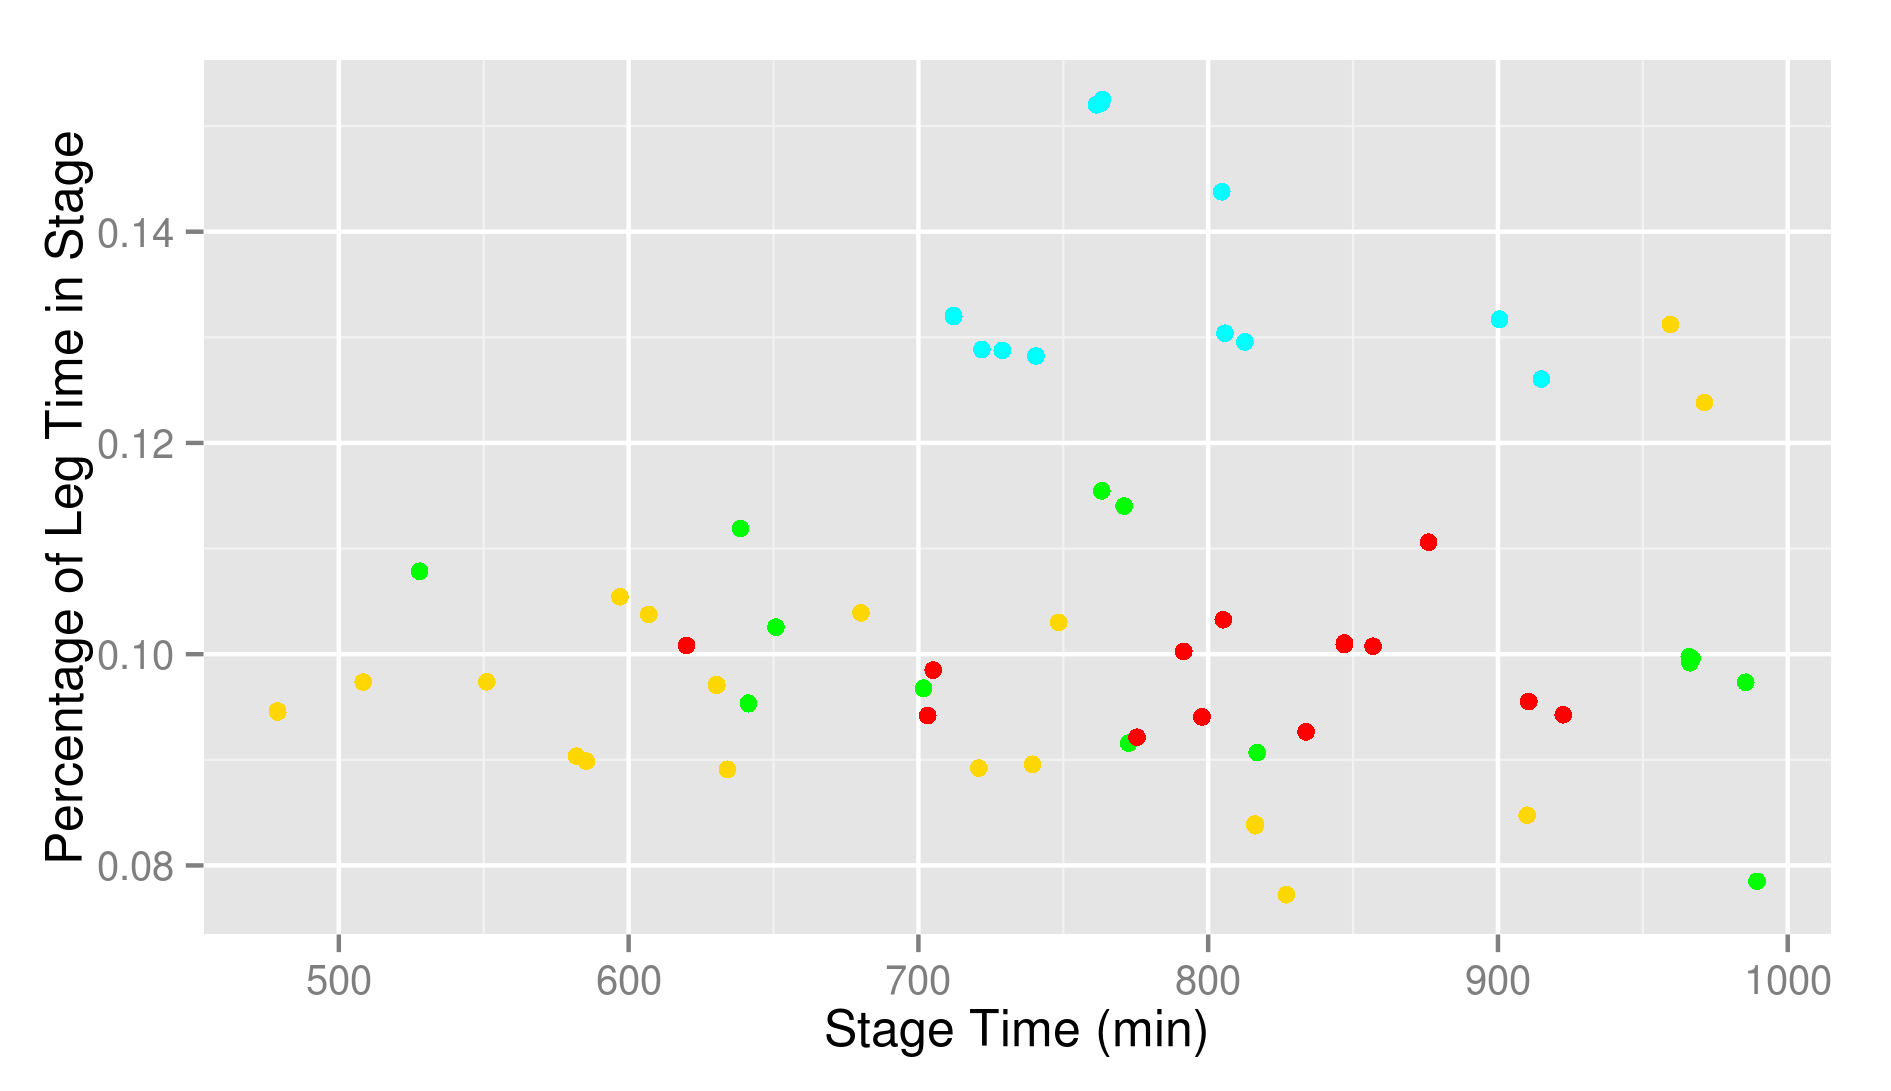
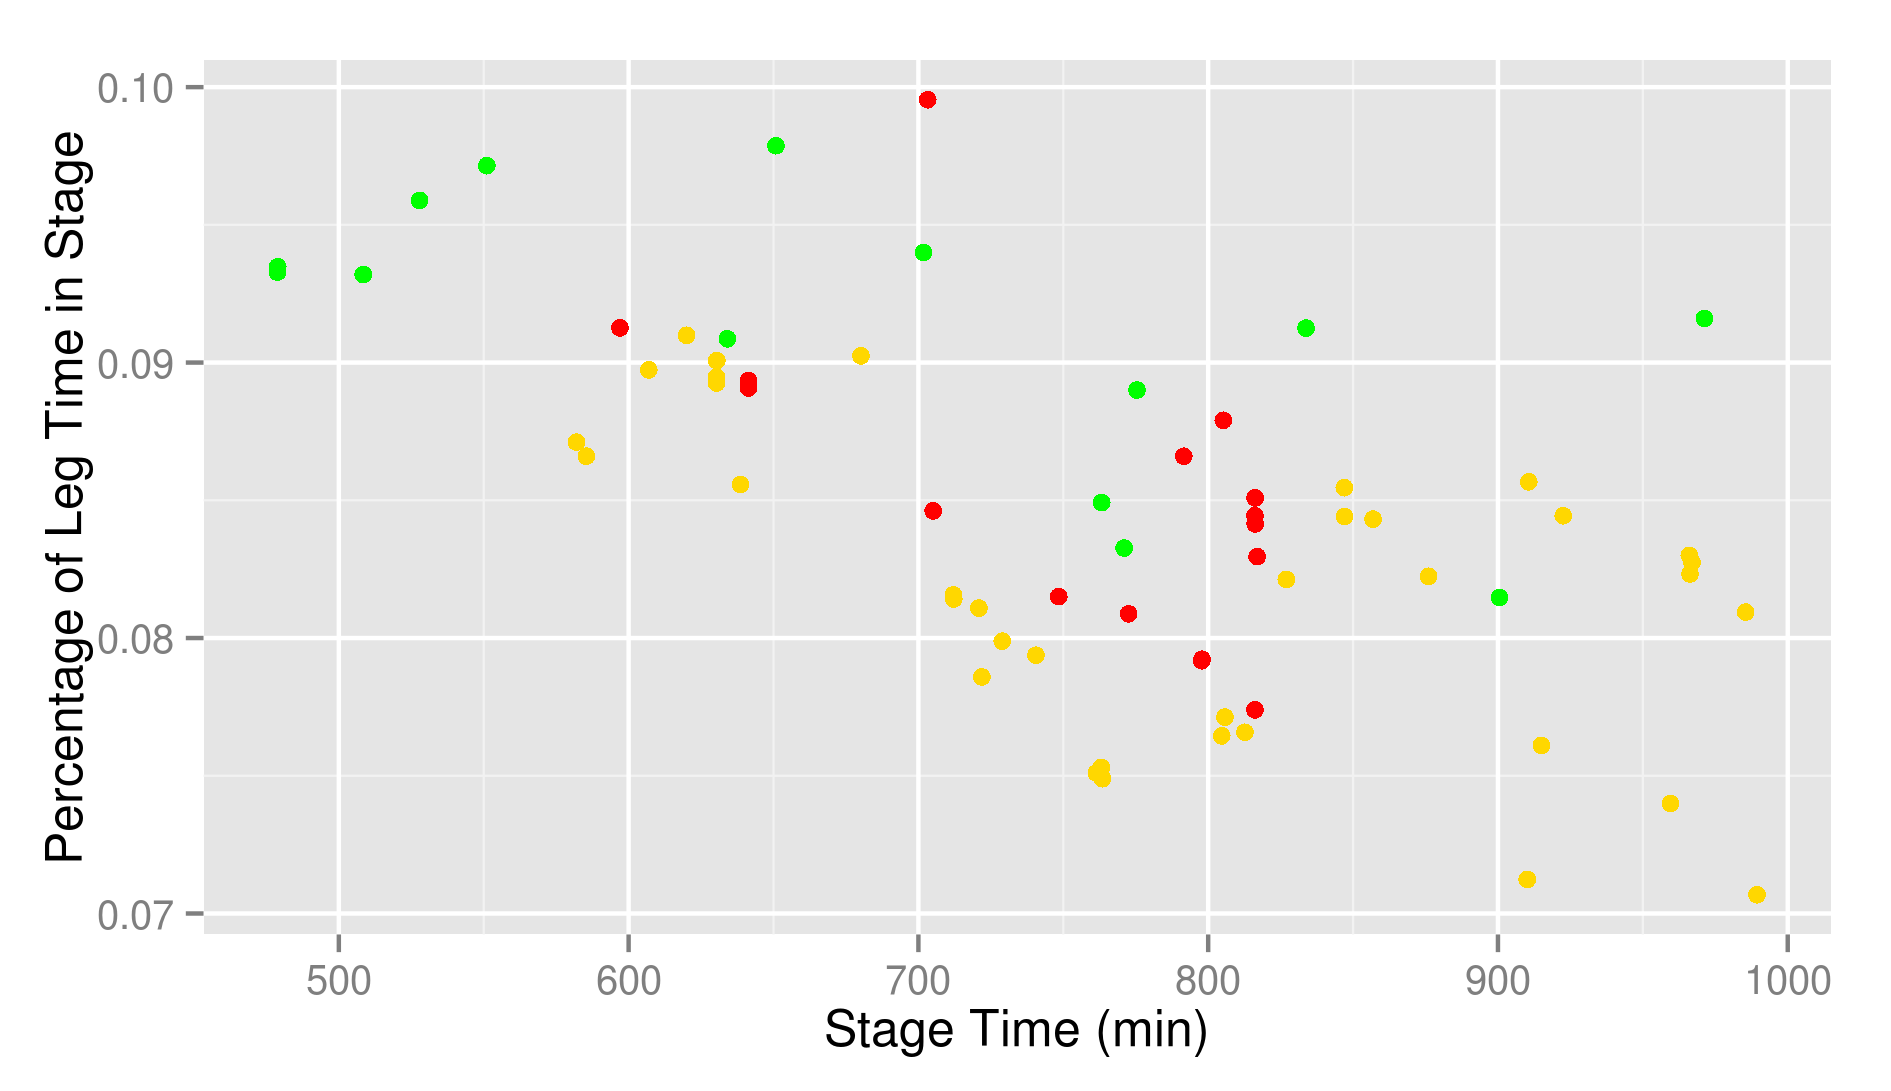
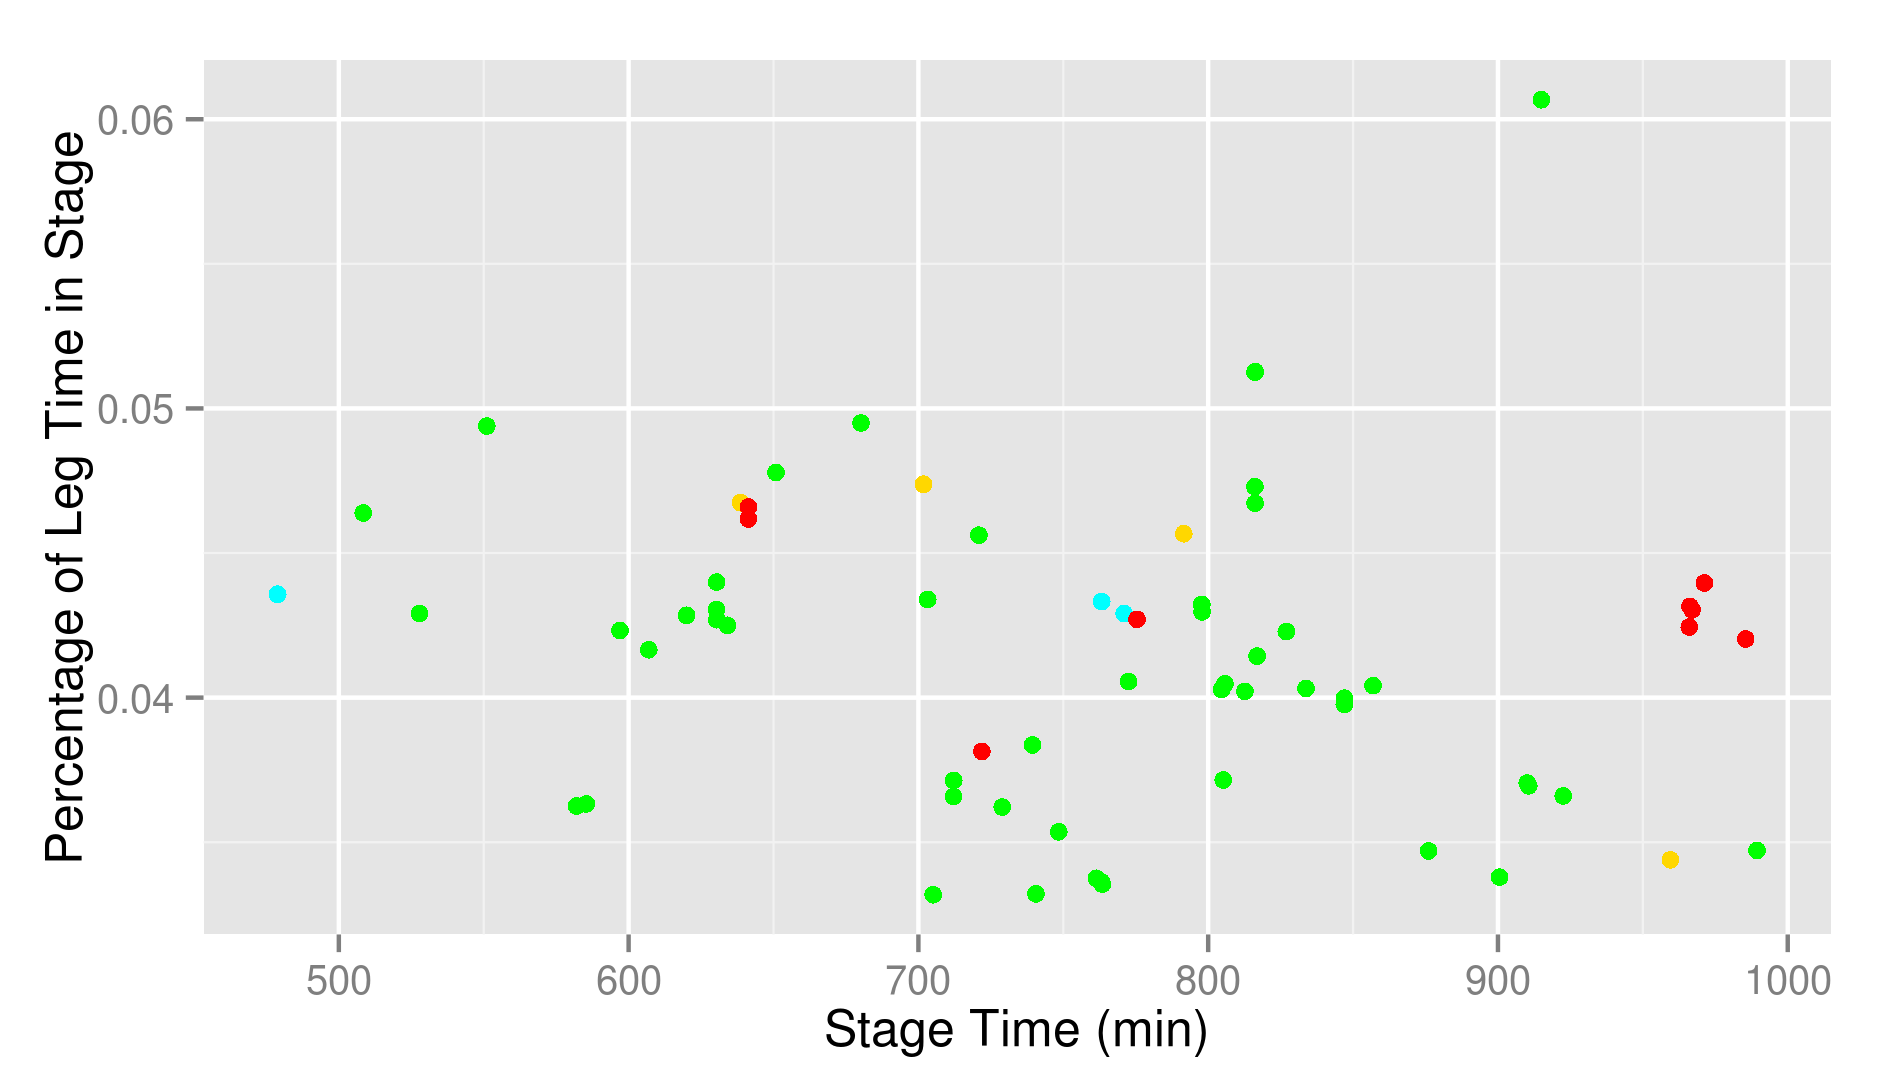
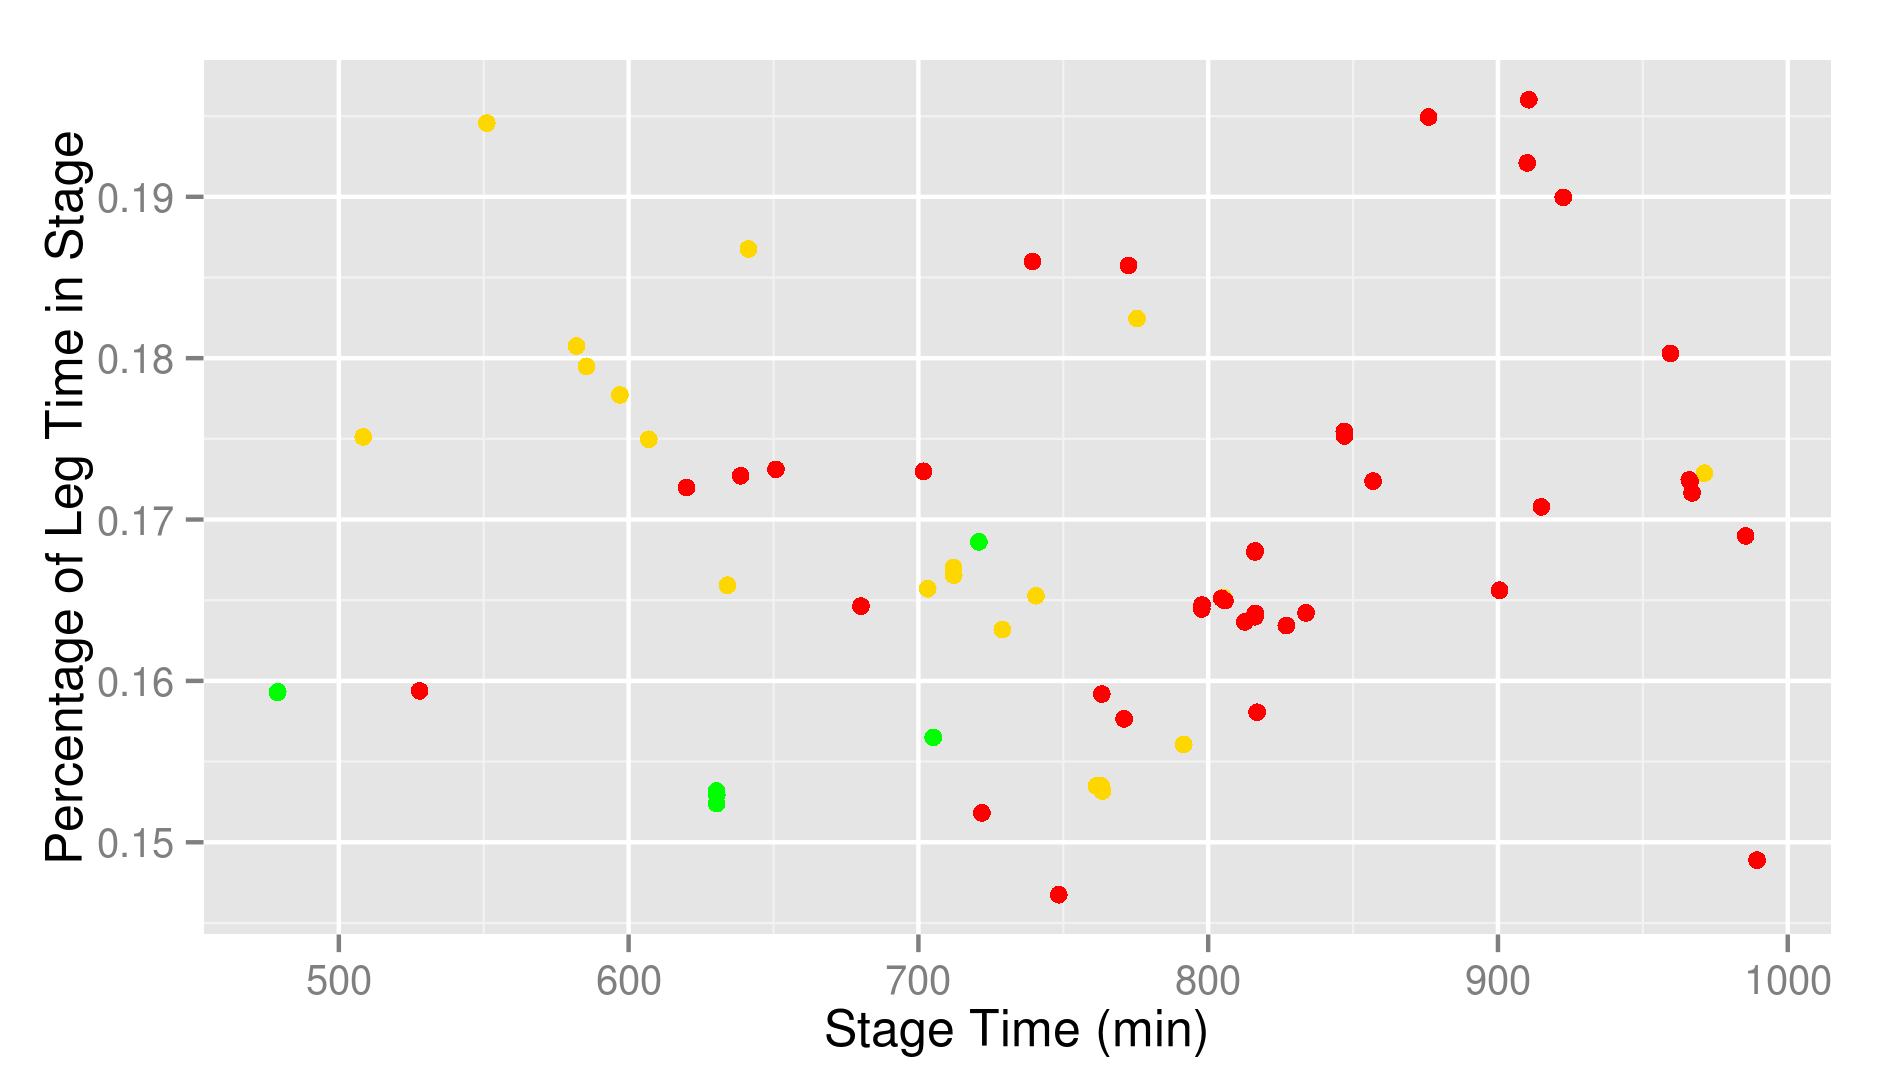
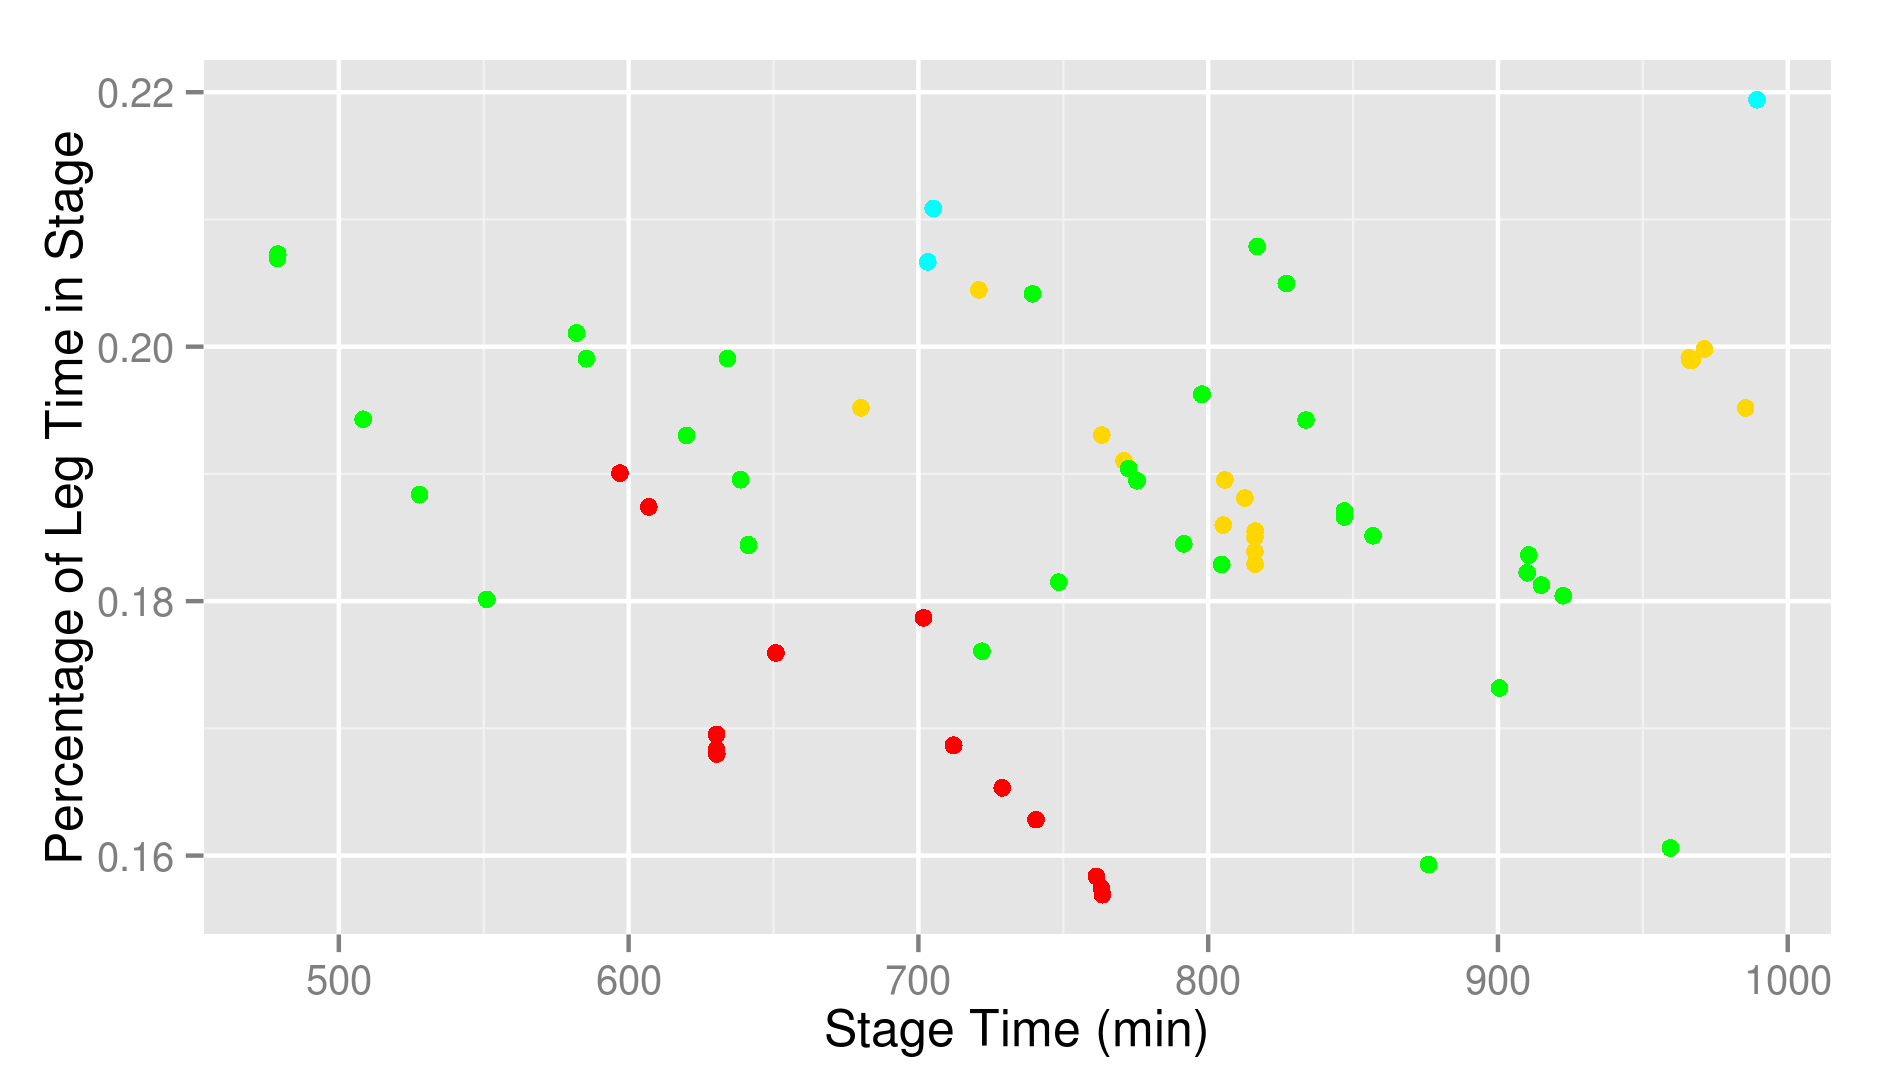
By far the longest leg is the last one, where the runners spend around 30% of the entire stage. When you get the map it is really an impressivly long line. Like for the previous two stages, I provide a scatterplot
My basic assumption that the percentage is independent of running time looks rather OK here. A quick look on the error bars for the slopes of the regression lines should confirm that.
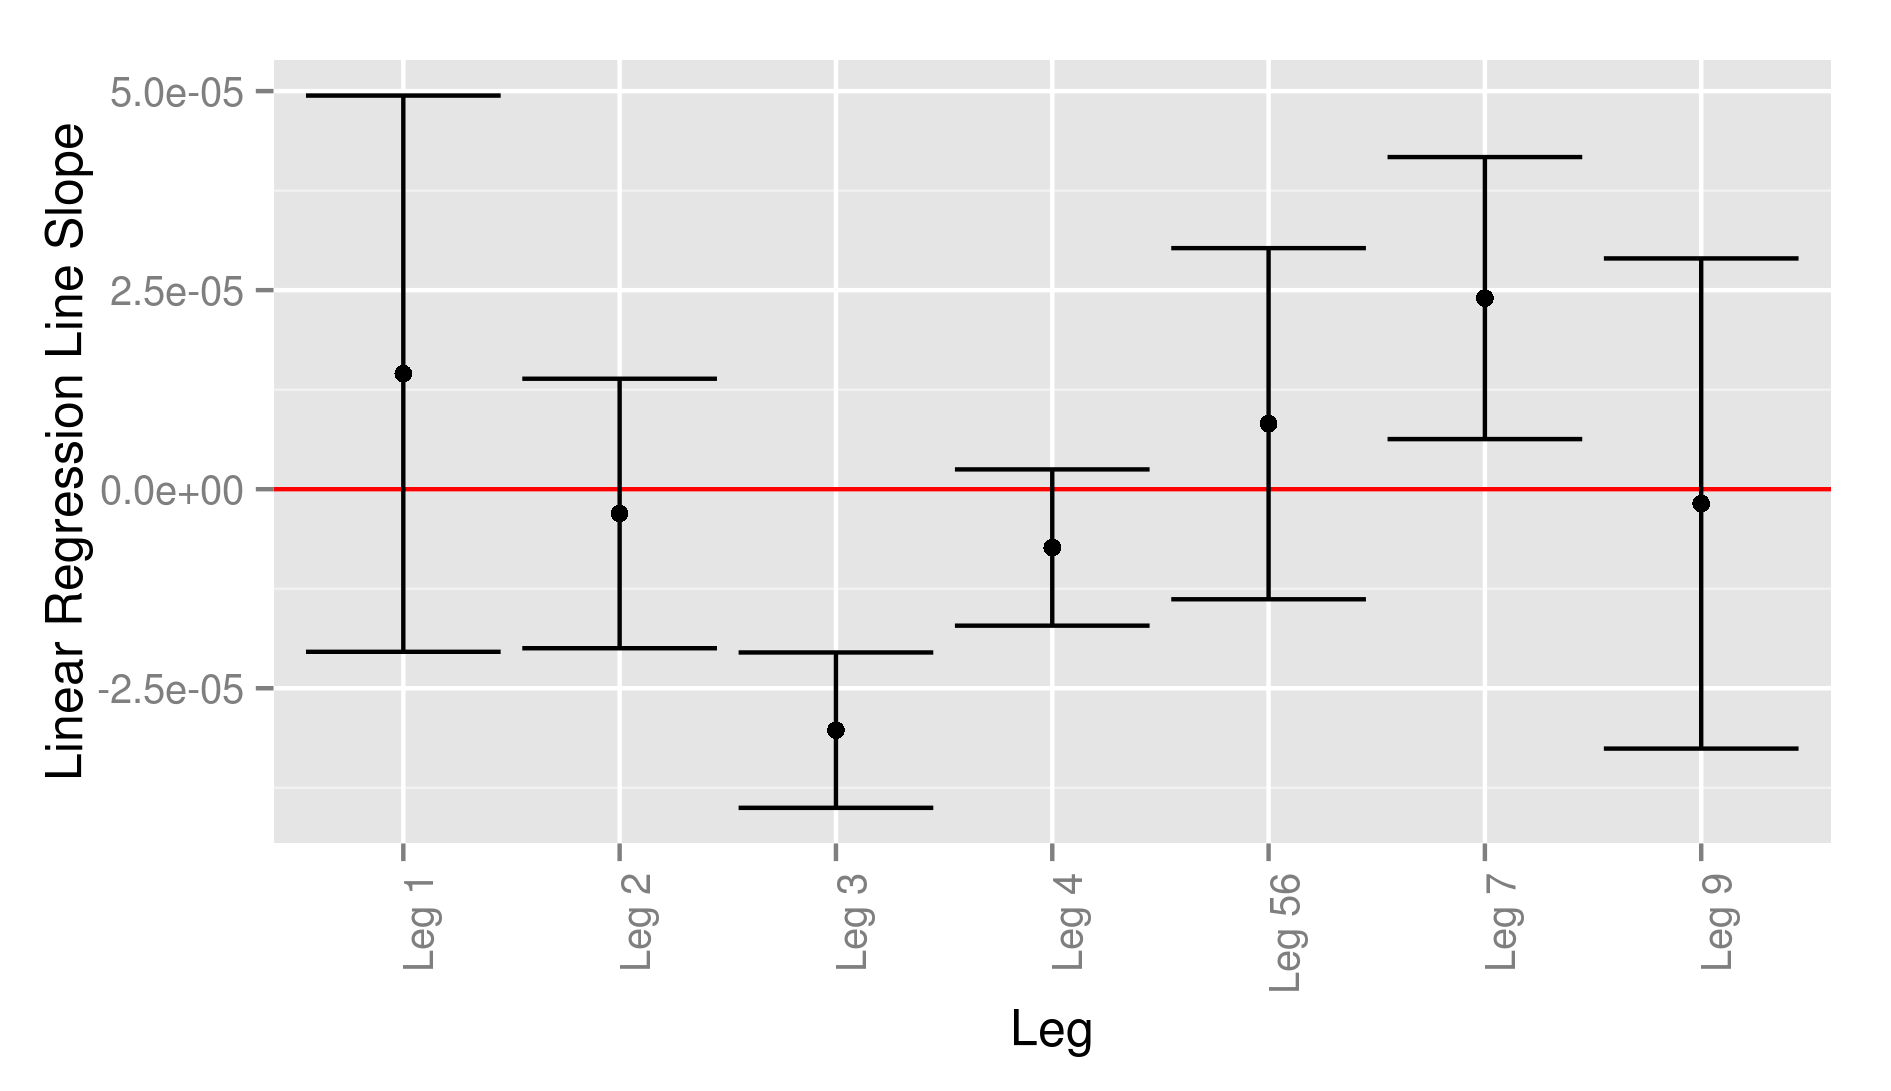
Not perfect, but I can live with that. It is good enough for me.
Just as for stages 1, 2 and 3, I made a set of boxplots. This is mine.
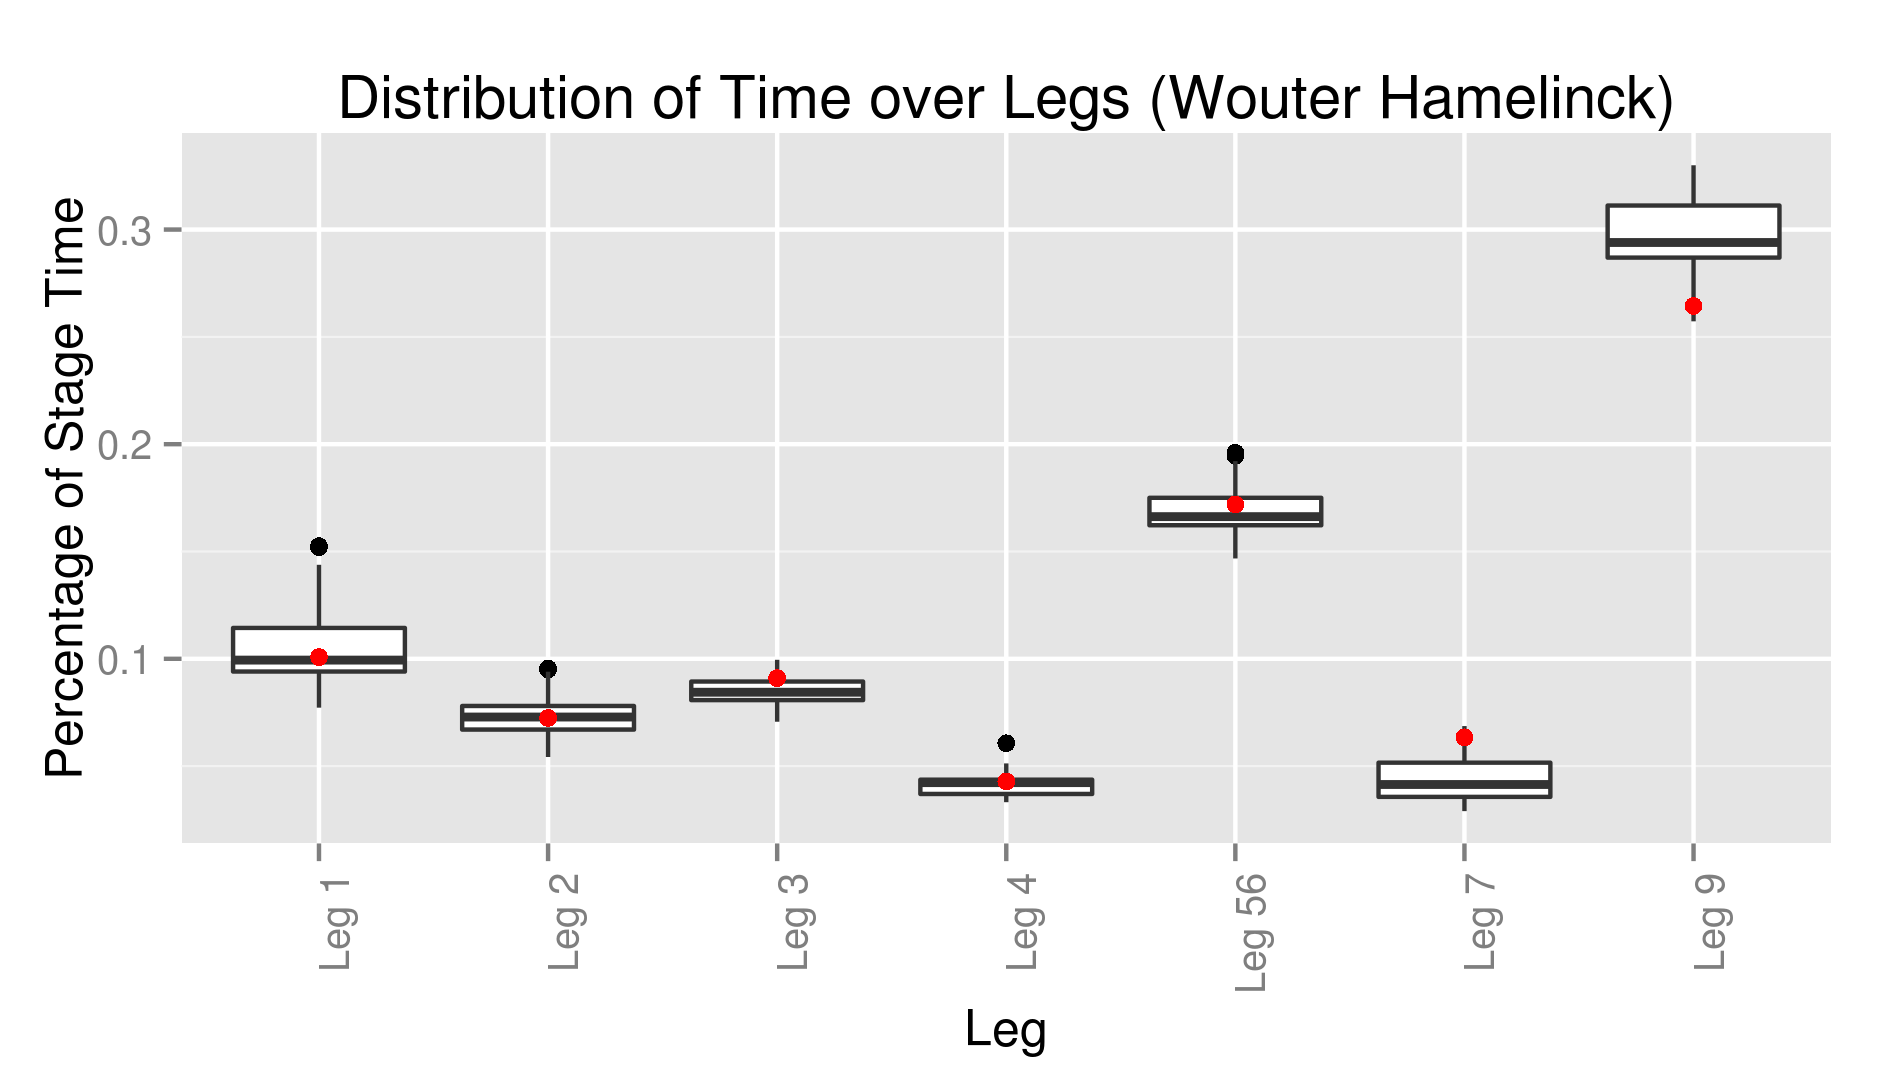
You see clearly where I had bad patches and made stupid mistakes. And that as a former marathoner I am still able to pick up speed in the final road leg. Even though my road running days are more than a decade behind me. Again, they are for all runners available in a zip file.
Leg 1
The fastest time was run by Jasmin Paris with 45.3 minutes.
The median time was 76.1 minutes.
This leg crosses first a big stretch with no obvious paths in the correct direction before entering a wind farm where roads are sometimes in the correct direction and sometimes not.
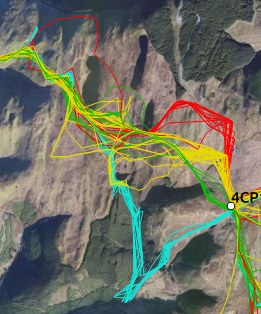
In the central part, the lines are a bit messy. I tried to separate by the way they approached the checkpoint. Most of the runners (24) followed the yellow line. The red line are runners that followed a road a bit more to the north (15 runners). To the south of the yellow line is the green option (15 runners). Finally, there is cyan (13 runners), which involves following clear tracks down a valley and up again.
Cyan is clearly a bad choice. No surprise, it is longer and has more elevation change. The other options are rather similar where yellow (mean of 9.5%) has a slight edge over red (9.8%) and green (10.0%). Next time, I would try yellow.
Leg 2
The fastest time was run by Konrad Rawlik with 36.5 minutes.
The median time was 54.6 minutes.
This is a leg that looks rather obvious with possibilities for lots of fast running.
There are again three big lines, this time defined by the way you leave checkpoint 1. There is a northern options that starts a bit cross country before hitting roads (25 runners). Alternatively, there is yellow that follows some roads further south (22 runners). The green option (12 runners) starts like the yellow one, but afterwards makes a loop to the south. It looks a lot like missing the turn for yellow. Finally, blue (6 runners) and cyan (2 runners) include some obvious mistakes. Cyan starts like red, but starts following green in the wrong direction when they join, while blue thinks running away from the checkpoint is any help.
The options of getting lost are obviously slower. Yellow and red look completely equivallent, while green looks a bit longer. Logic, because green is a longer version of yellow. I think it doesn’t matter if you take red or yellow. Just don’t get lost.
Leg 3
The fastest time was run by Jim Mann with 44.7 minutes.
The median time was 63.2 minutes.
This is a leg involving a bit of road running.
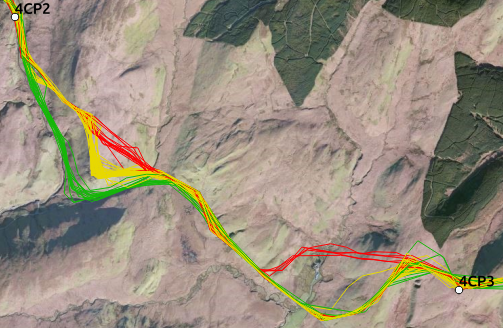
In the first half of the leg there are again three options. Basically, the question is how badly you want to avoid the road. Green is going around the mountain following the road (14 runners). Then, we have yellow (37 runners), which involves following a path up the mountain. Finally, red (16 runners) starts like yellow but sticks to the straight line.
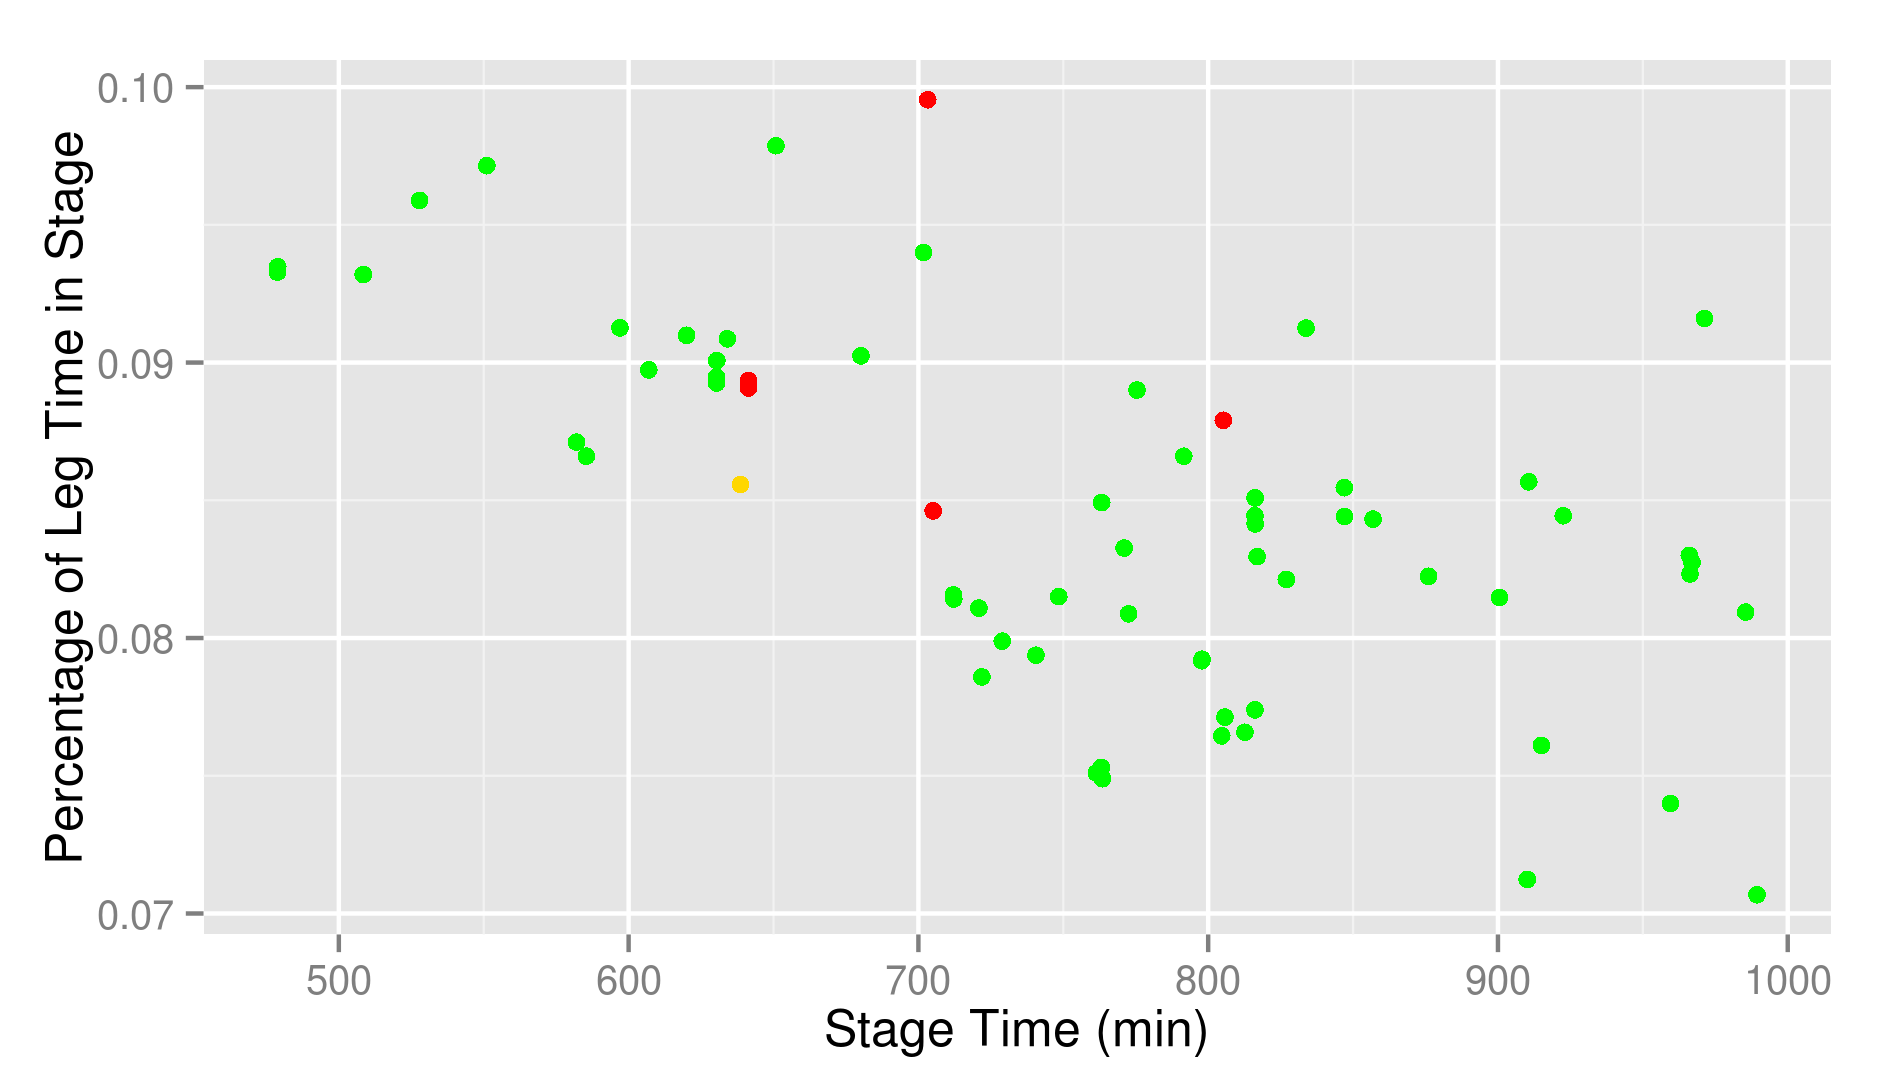
For me the green (average 9.1%) is the slowest option, while yellow (8.2%) and red (8.5%) are more or less equivalent. Remarkable enough the fastest runners have systematically taken an option that I consider suboptimal. This is probably the only leg where this happens.
The leg is not over yet and more choices are to be made.
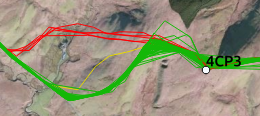
Most runners (61) followed the road until it makes no sense any more (green). A few (6), on the other hand, tried to keep up the straight line for the start of the stage (red). Finally, one runner tried something in between (yellow).
Not very convincing for me. It probably doesn’t really matter.
Leg 4
The fastest time was run by Jasmin Paris and Jim Mann with 20.9 minutes.
The median time was 31.4 minutes.
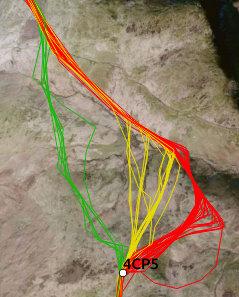
Here, you follow a very wide ridge before heading down to the checkpoint in the valley.
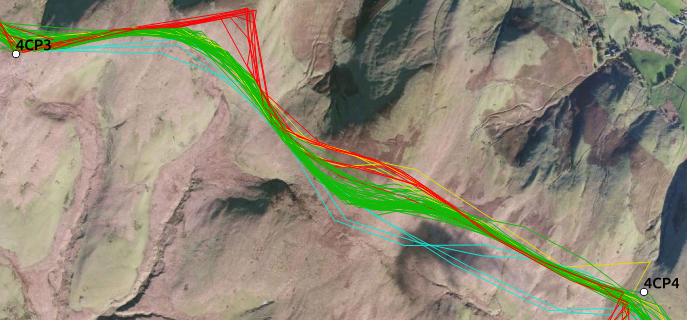
The big chunck (50 runners) followed the green band. The red line (9 runners) goes to the first summit, where there is no checkpoint, and makes there a turn instead of turning more gently. Runners following the yellow line (4 runners) started along the green band, but went a bit further to the north in the second half of the stage, where de red runners passed. Finally, 4 runners followed a line a little further to the south (cyan).
Unsurprisingly, hard to tell any differences from this.
Leg 5
The times of checkpoint 5 are not available. The fastest time over legs 5 and 6 combined was run by Jim Mann with 76.3 minutes.
The median time was 123.0 minutes.
I will use in the discussion of both legs 5 and 6 the time run between CP4 and CP6. The first question for this leg is how you get to the other side of the mountain to the east of CP4.
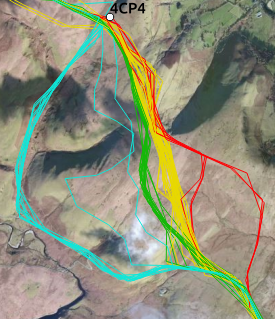
One option is to go all the way around by descending to the road and add a lot of road running (cyan, 13 runners). All the other options are heading straight over the mountain. The central yellow line was followed by 34 runners. Six runners made a turn to the east before heading south to the road (red). Finally, the green option (14 runners) is slightly more to the west than the main yellow line.
Clearly, cyan and red are not exactly fast options. I would avoid those if I were you. Between yellow and green it doesn’t really matter. Both appear to be about equally fast.
This brings us not yet to checkpoint 5. To get there we need to get to the summit of Esgair Penygareg from that road.
There are multiple options that I devided into three groups. The first option (red, 39 runners) is following the road until you get as close to the summit as possible and climb from there. The yellow group are 21 runners that were a bit less patient and left the road earlier. Finally, there is green group (7 runners) that absolutely disliked the road and simply went cross country.
This is another place where the faster half and the slower half act entirely differently. Green and yellow are for the faster runners, while the slower runners all opt for red. The most remarkable is the strong performance of green. I think that I will test that a next time. It is certainly not slow and allows you to avoid a huge stretch of road running. But some more data on that option would be great.
Leg 6
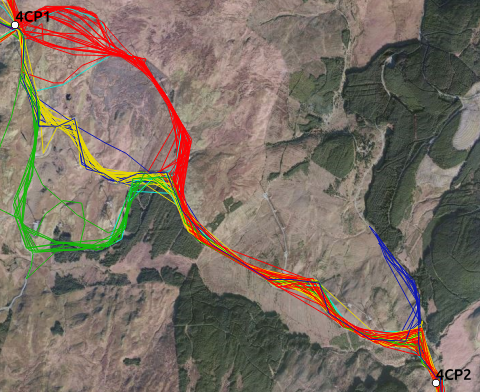
This leg is leading up to the halfway checkpoint. From CP5 you basically have to get to the other side of a mountain. The obvious question is which side of the mountain you should take.
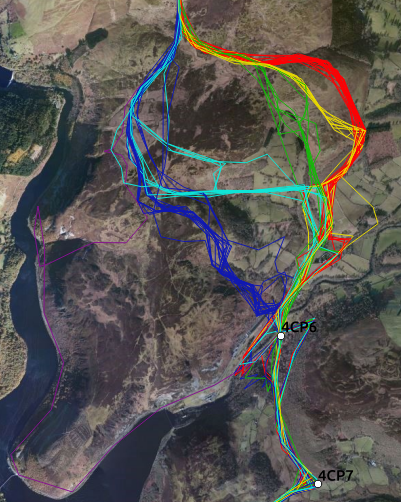
There are a lot of options. Firstly, you can go to the eastern side. Even there you have plenty of choices. The most obvious path (red) was followed by 18 runners. Some thought it better to take a slightly shorter turn (yellow, 9 runners) or a much shorter turn (green, 9 runners). Then, there are those that passed on the western side. Of those, 11 runners crossed over to the path taken by the previously mentioned runners by following a path on the south side of the mountain (cyan). Others (19 runners, blue) sticked better to their choice and went in a more straight line. Finally, one runner (magenta) did something that is probably most adequately described as getting horribly lost.
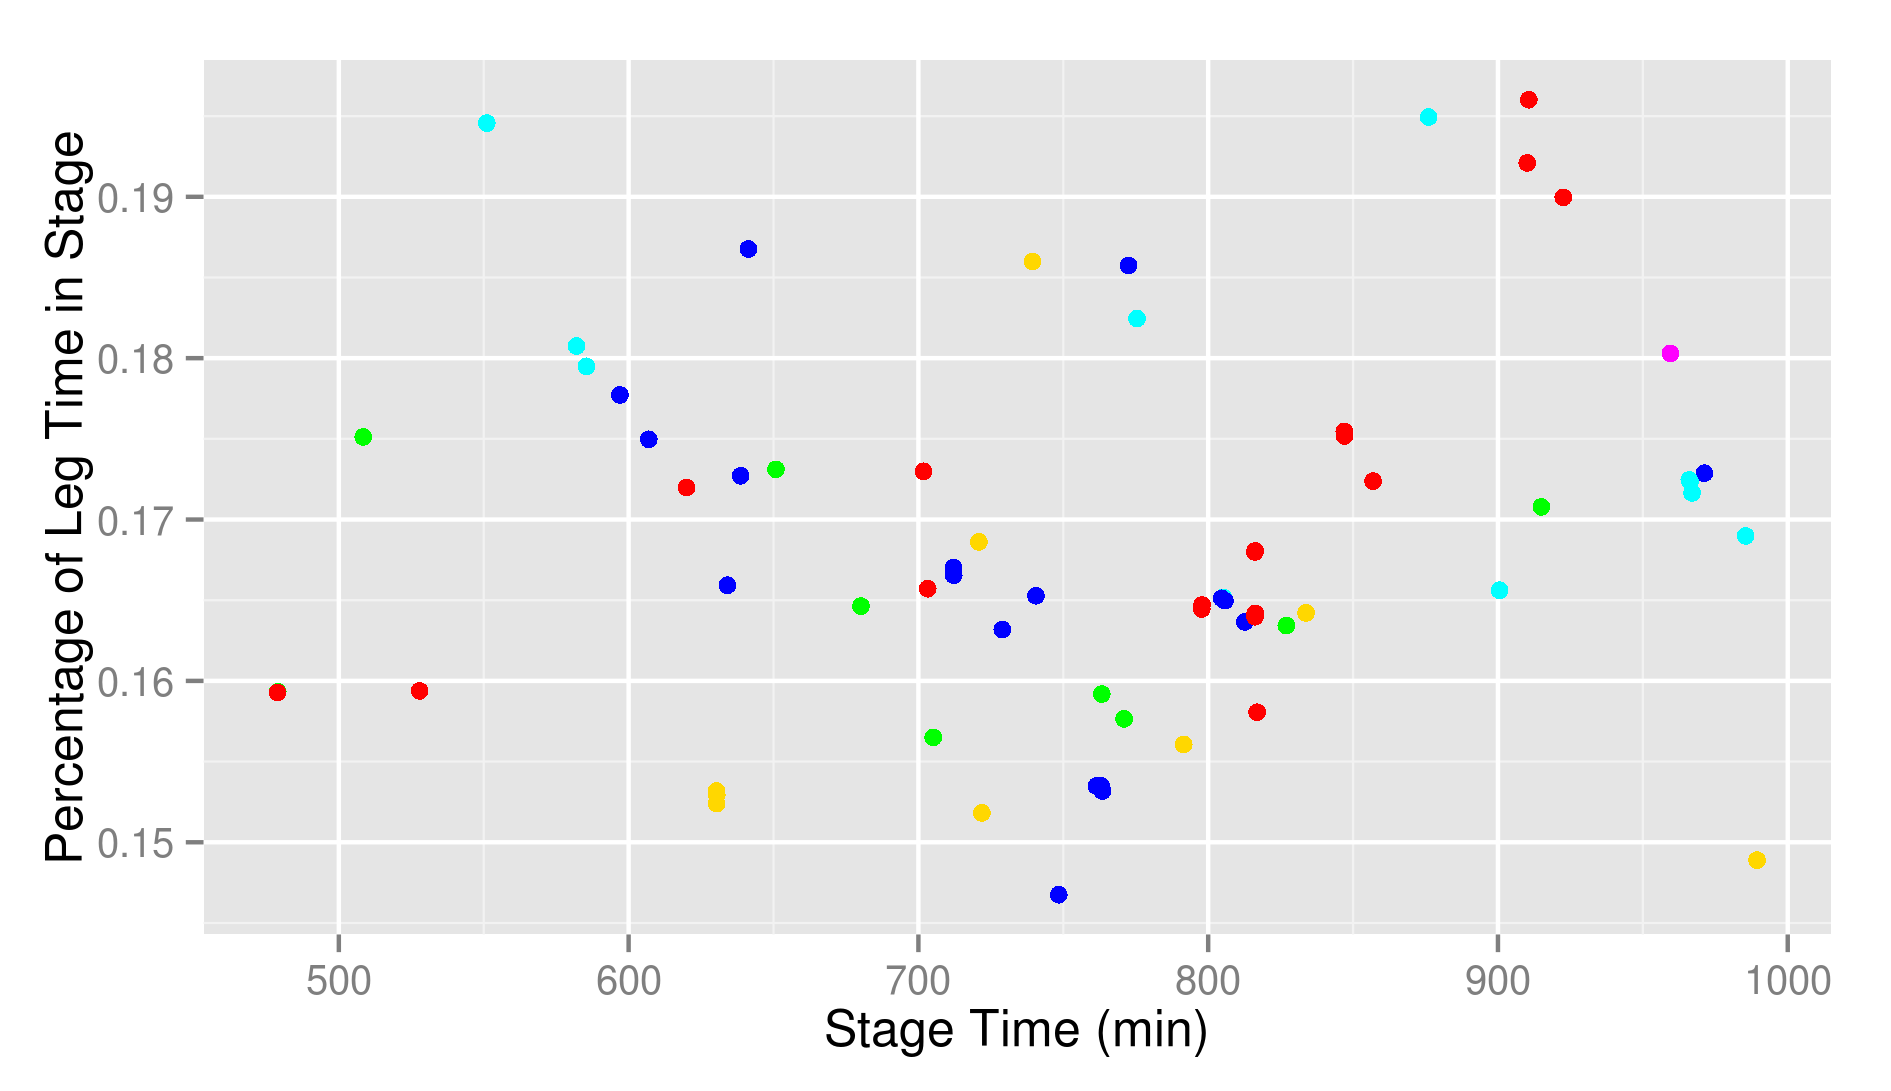
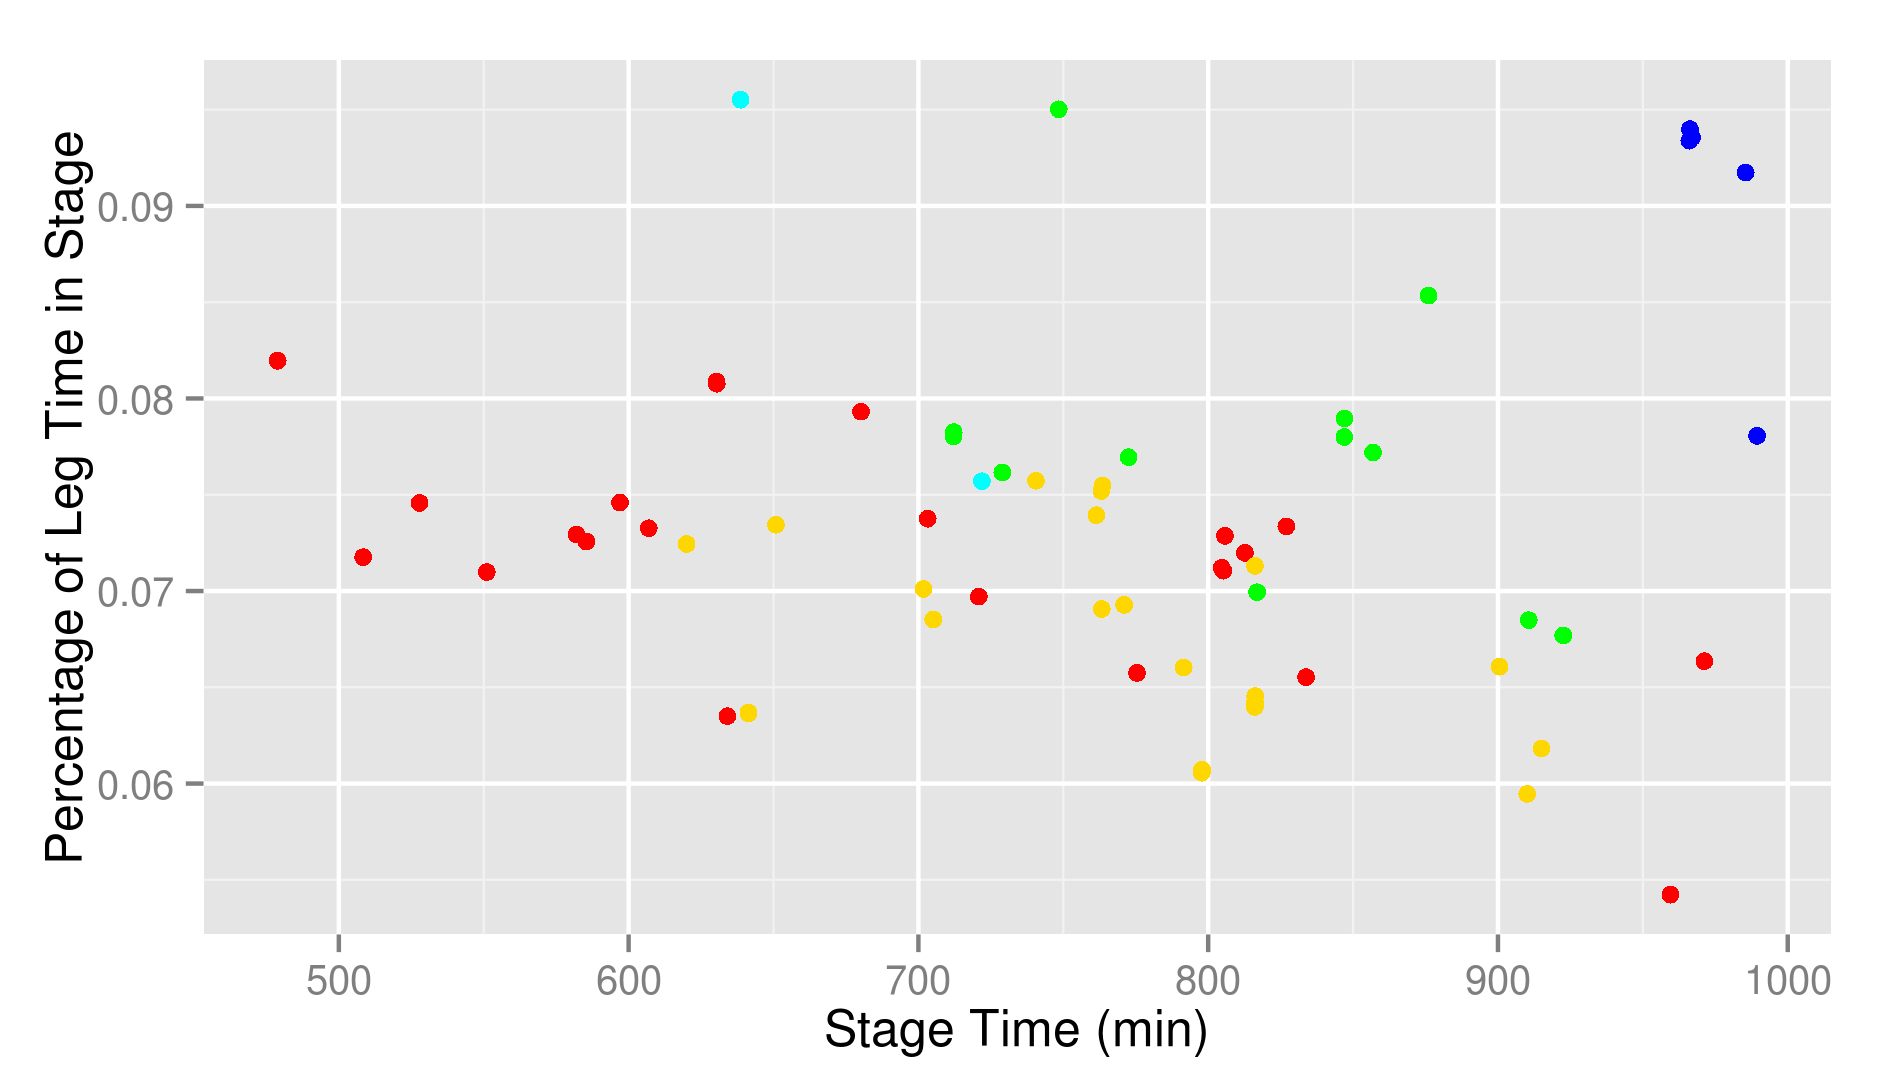
Well, the least we can say is that the result is colourful. It is also remarkable that none of the options is reserved for faster or slower runners. And there is no clear winner. But remember that I’ve put the times over legs 5 and 6 together over this stretch. This part of the analysis will certainly benefit enormously from determining the times for both legs separately.
Leg 7
The fastest time was run by Jasmin Paris with 15.0 minutes.
The median time was 33.8 minutes.
Remember that this is the leg following the halfway checkpoint and as such includes time spent in the aid station. The leg is too short to be interesting.
Leg 8
The fastest time was run by Konrad Rawlik with 98.8 minutes.
The median time was 147.1 minutes.
The first part of this leg is not very interesting because you simply have to follow an obvious path. The second half is more interesting.
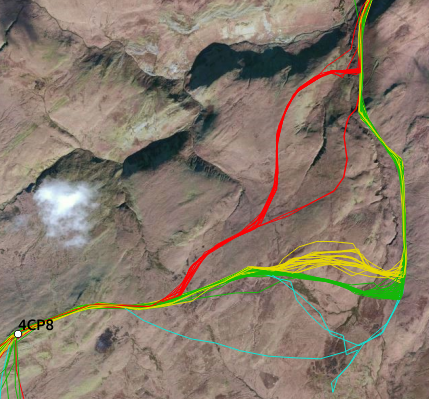
There are a few distinct possibilities. The most popular one is following the path to more or less the col and turn rather straight west to the summit with the checkpoints. There are to distinct turning points. There is the one of yellow (16 runners) and a bit further south the green one (34 runners). Some runners (3, cyan) apparently went a bit to far south before turning. Finally, there are 14 runners who risked going more cross country (red).
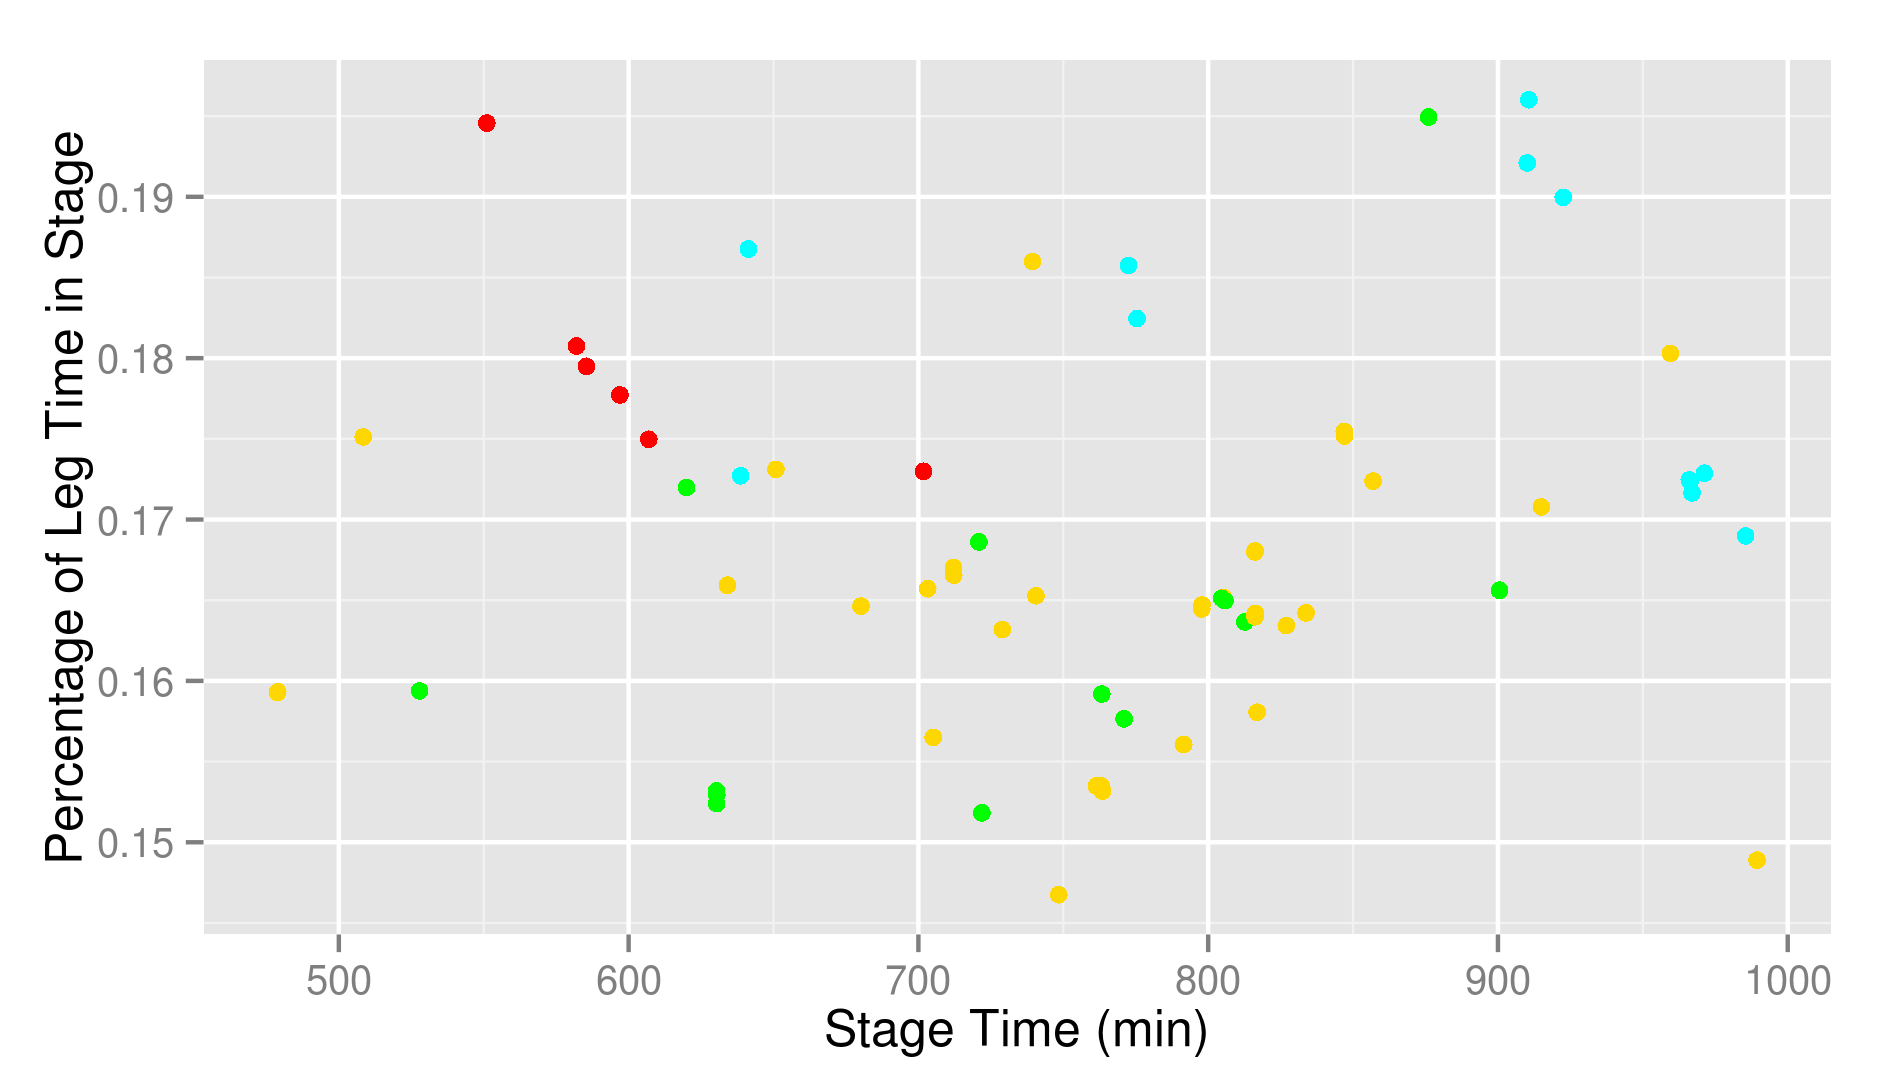
Well, this is a surprise for me. The fastest way is clearly also the shortest. The average percentages for the different options are 17.0% (red), 19.2% (yellow), 18.9% (green) and 21.2% (cyan). This is one of the places where the less obvious choice is faster. There is about 10 minutes to be gained at this point. As for the difference between yellow and green, you shouldn’t bother. It is something that we’ve seen a few times. The difference between making a turn just right or slightly earlier or later is not something that will break or make your race.
Leg 9
The fastest time was run by Jasmin Paris with 138.2 minutes.
The median time was 231.8 minutes.
This is a very long leg to the finish line. It is one of my least favorite because it involves a lot of road running (even though I’m rather able to do that as I ran the sixth time of this leg). But leaving CP8 there is an interesting choice to be made.
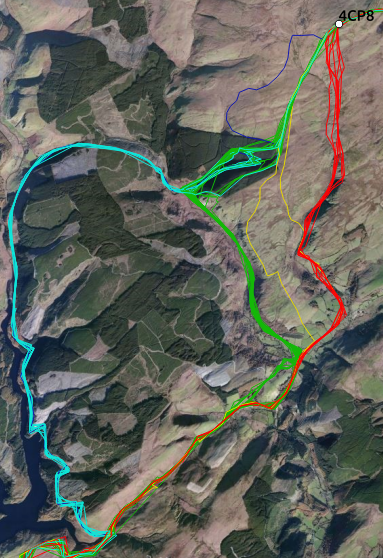
A first option is to head south, find a valley, at some point descend into the valley and start following the path that is there (red, 9 runners). The others left CP8 to the SW and went for the corner of the forest. After the forest there are again two options. The majority followed to road to join up with the red runners (green, 44 runners). The alternative is cyan (11 runners) which is certainly longer but involves less elevation change and probably a smoother running surface. Basically, it leaves out a small pass the the others have to tackle before hitting the lake. Finally, there are yellow (2 runners) which involves starting SW before switching to the red line and one runner who strayed a bit before finding the forest corner (blue).

What we see is that is once again doesn’t really matter. Cyan looks slow to me, but between red and green… There is no telling. I’m also a bit surprised by the good performance of yellow. That is another choice where I would love to see more data.