Day 1 of the Dragon’s Back Race started in Conwy Castle and finished south of Yr Wyddfa after a crossing of Snowdonia including the Welsh 3000ers.
The entire stage
The fastest time was run by Jim Mann with 470.0 minutes.
The median time was 747.4 minutes.
Below are the histograms of the percentage spent over each leg. In this stage the legs are numerous and short, which means that most of the time the spread of the percentages is minor.

My main assumption was that percentage spent over each leg is constant over all runners. Let’s see how this assumption holds together.
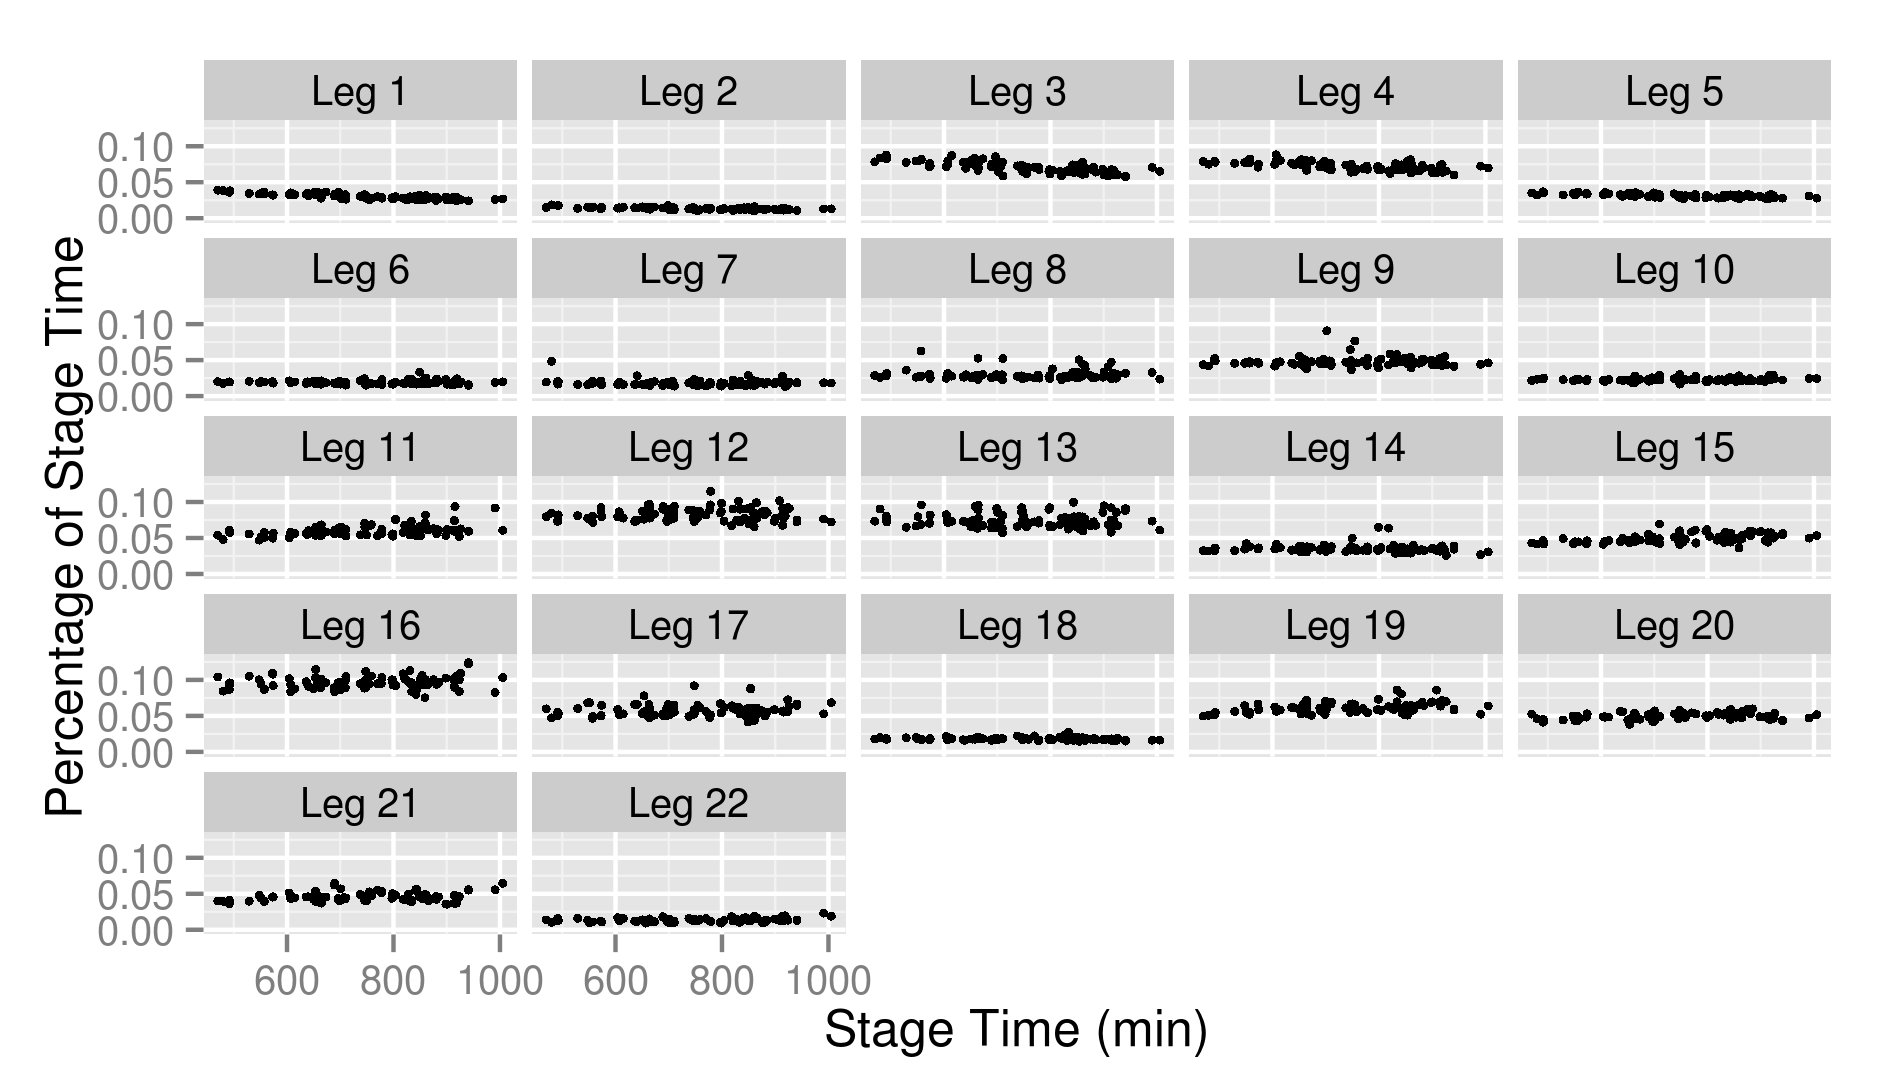
Over the first legs, the assumption is obviously not correct. Just visually you can see that this is not a flat line. To make this a bit more precise, I calculated the slopes of the linear regression lines for each of those stages. If this slope is zero, we have a flat line and the assumption holds. Otherwise the assumption doesn’t hold.

Faster runners tend to spend a higher percentage of their stage time to cover those legs. Otherwise said: the fast guns take is relatively slow at the start. Or another way to put things: they slow less down towards the end. But once we arrive at leg 6-7 the plot effectively flat-lines and my assumption looks more or less correct. Apart from those first stages I assumed that percentage of the stage would be a good measure to obtain the effect. In those first stages the route was rather obvious, so I don’t really care about those.
Another way of looking at this, is seeing over which parts you were flying and, conversely, where you had a rough time. For this I made a boxplot in which you can see my position with respect to the rest. The stages where the red dot is on the low end of the box, I was running strongly, while when the red dot is higher than the box, I was suffering (or making some bad mistakes).
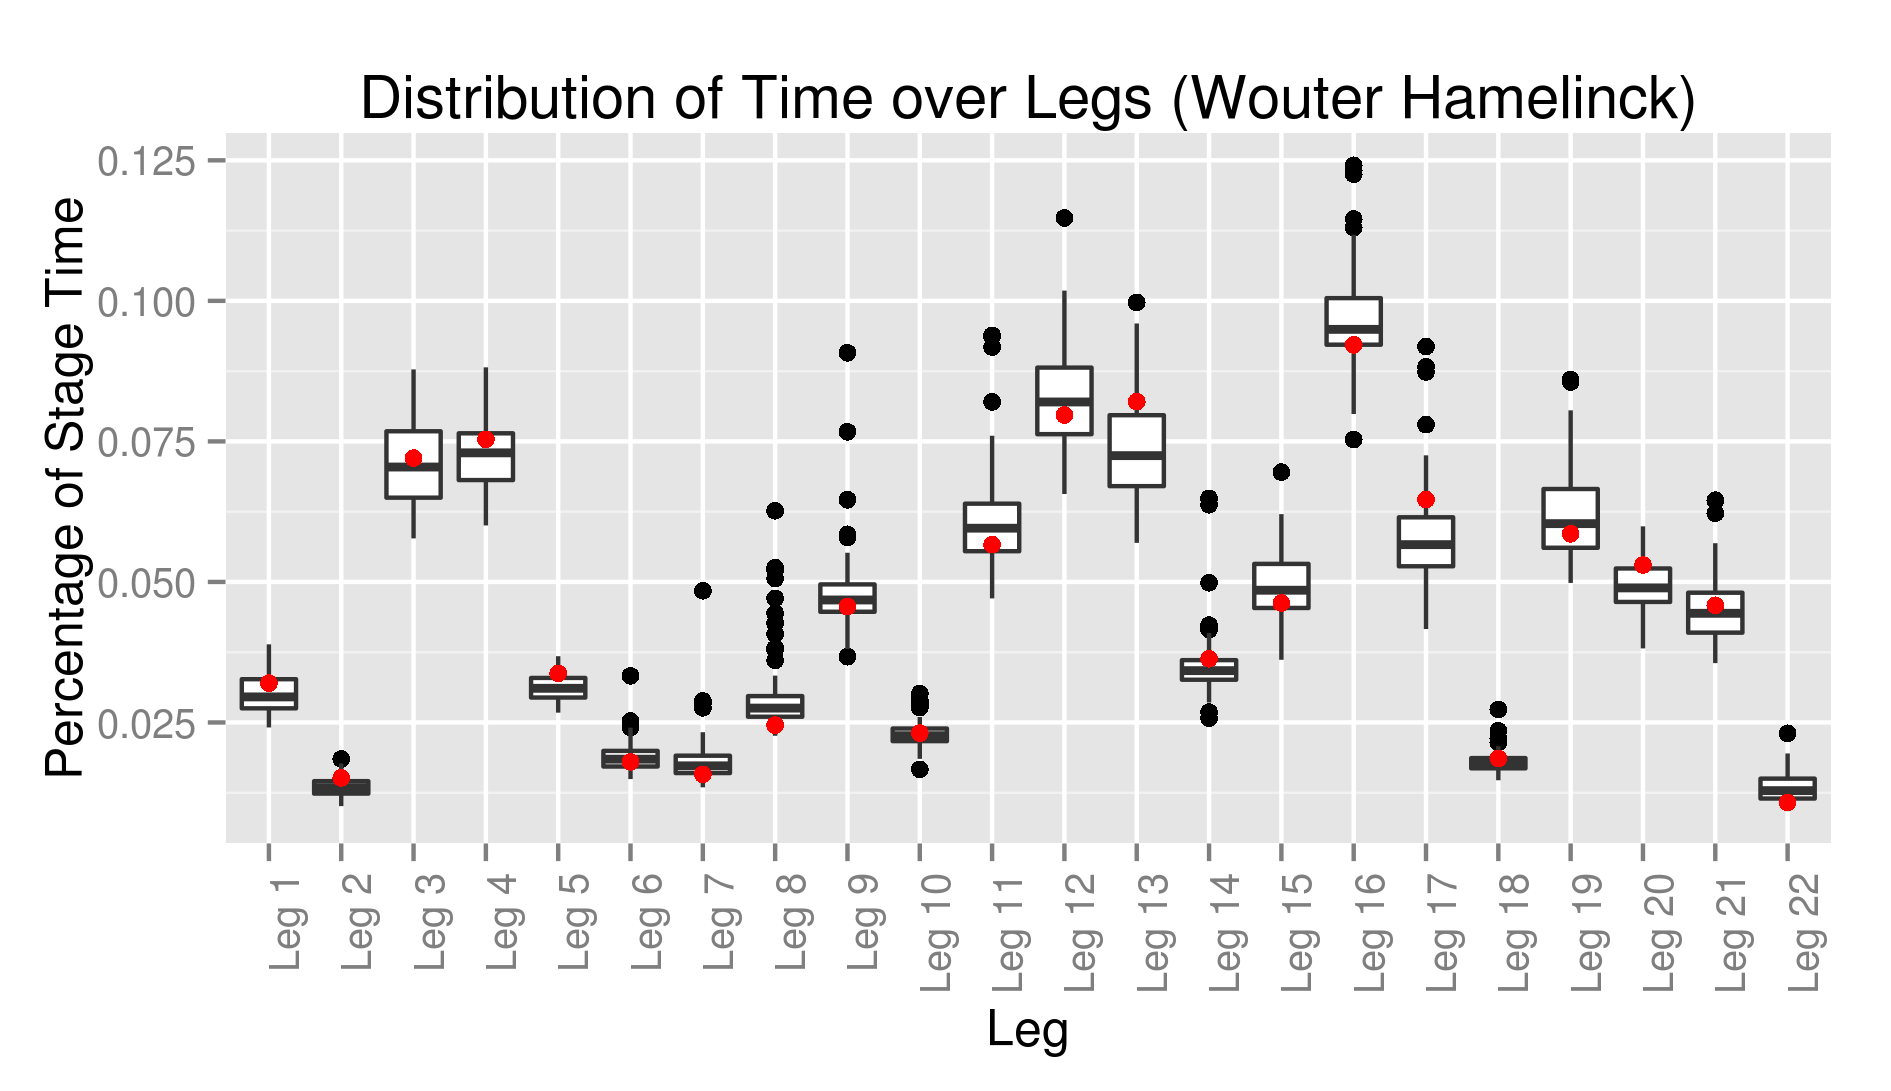
Because the sum of all percentages must evidently be 100%, everybody will have legs where he is low and other legs where he is high. As a comparison, I also added the boxplot showing Jim Mann.
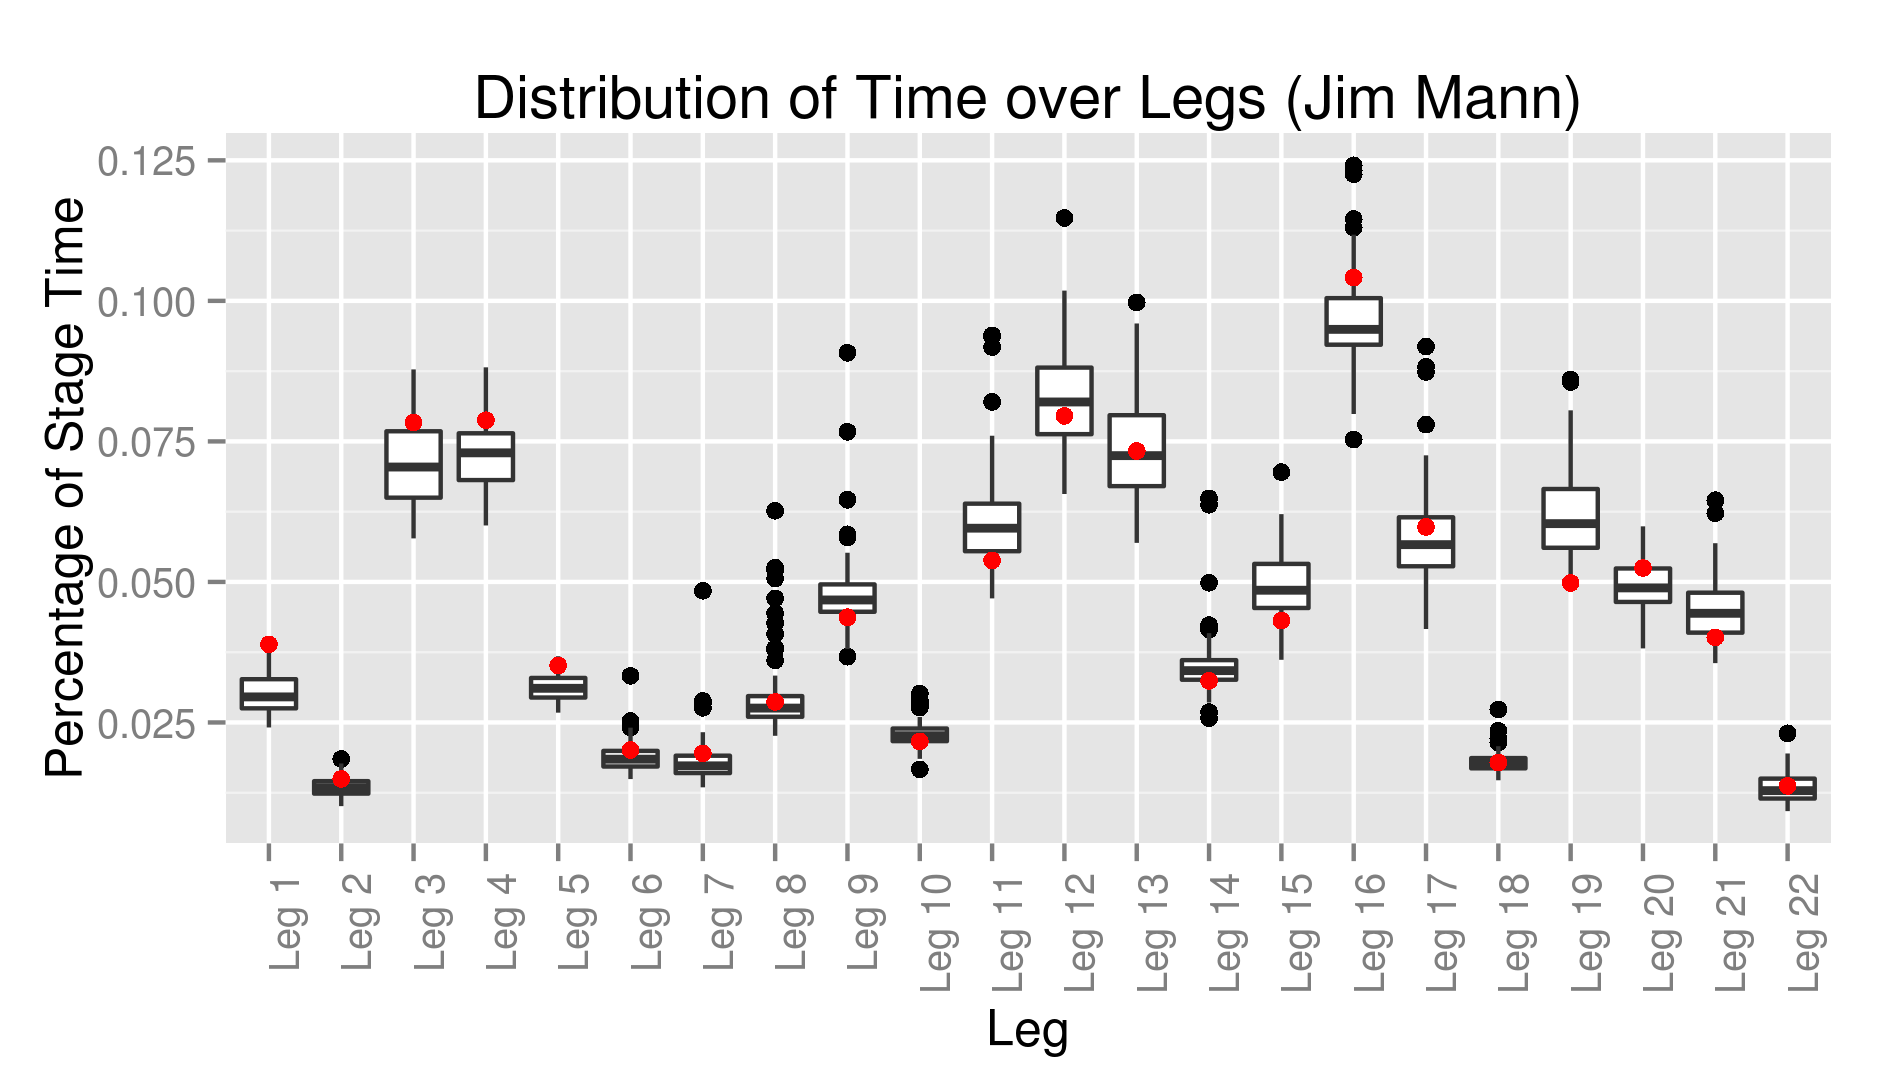
You probably are more interested in your own data. So, the plots for all runners are available in a zip file.
One runner is listed in the race results as a finisher, but with intermediate times that suggest he dropped halfway. I ignored this runner in the analysis. Also keep in mind that I only consider people that finished the stage. This excludes notably Pavel. A total of 120 runners are considered in the analysis on this page.
Leg 1
The fastest time was run by Jasmin Paris with 17.7 minutes.
The median time was 22.5 minutes.
Everyone took the obvious way.
Leg 2
The fastest time was run by Jim Mann with 7.0 minutes.
The median time was 10.1 minutes.
Probably there were some minor variations, but the tracks are not precise enough to distinguish them.
Leg 3
The fastest time was run by Jim Mann with 36.8 minutes.
The median time was 53.3 minutes.
Everyone took the obvious way, except for a few people that strayed too far east. It is not very interesting, but to get started let’s take a look into that. It will give an idea of what you can expect for the other legs and other stages. This is what the tracks look like.
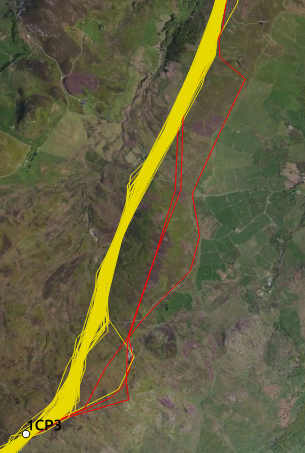
Runners come from the north. Most follow the same line (yellow), but we see that a few (3 runners) are further to the east (red).
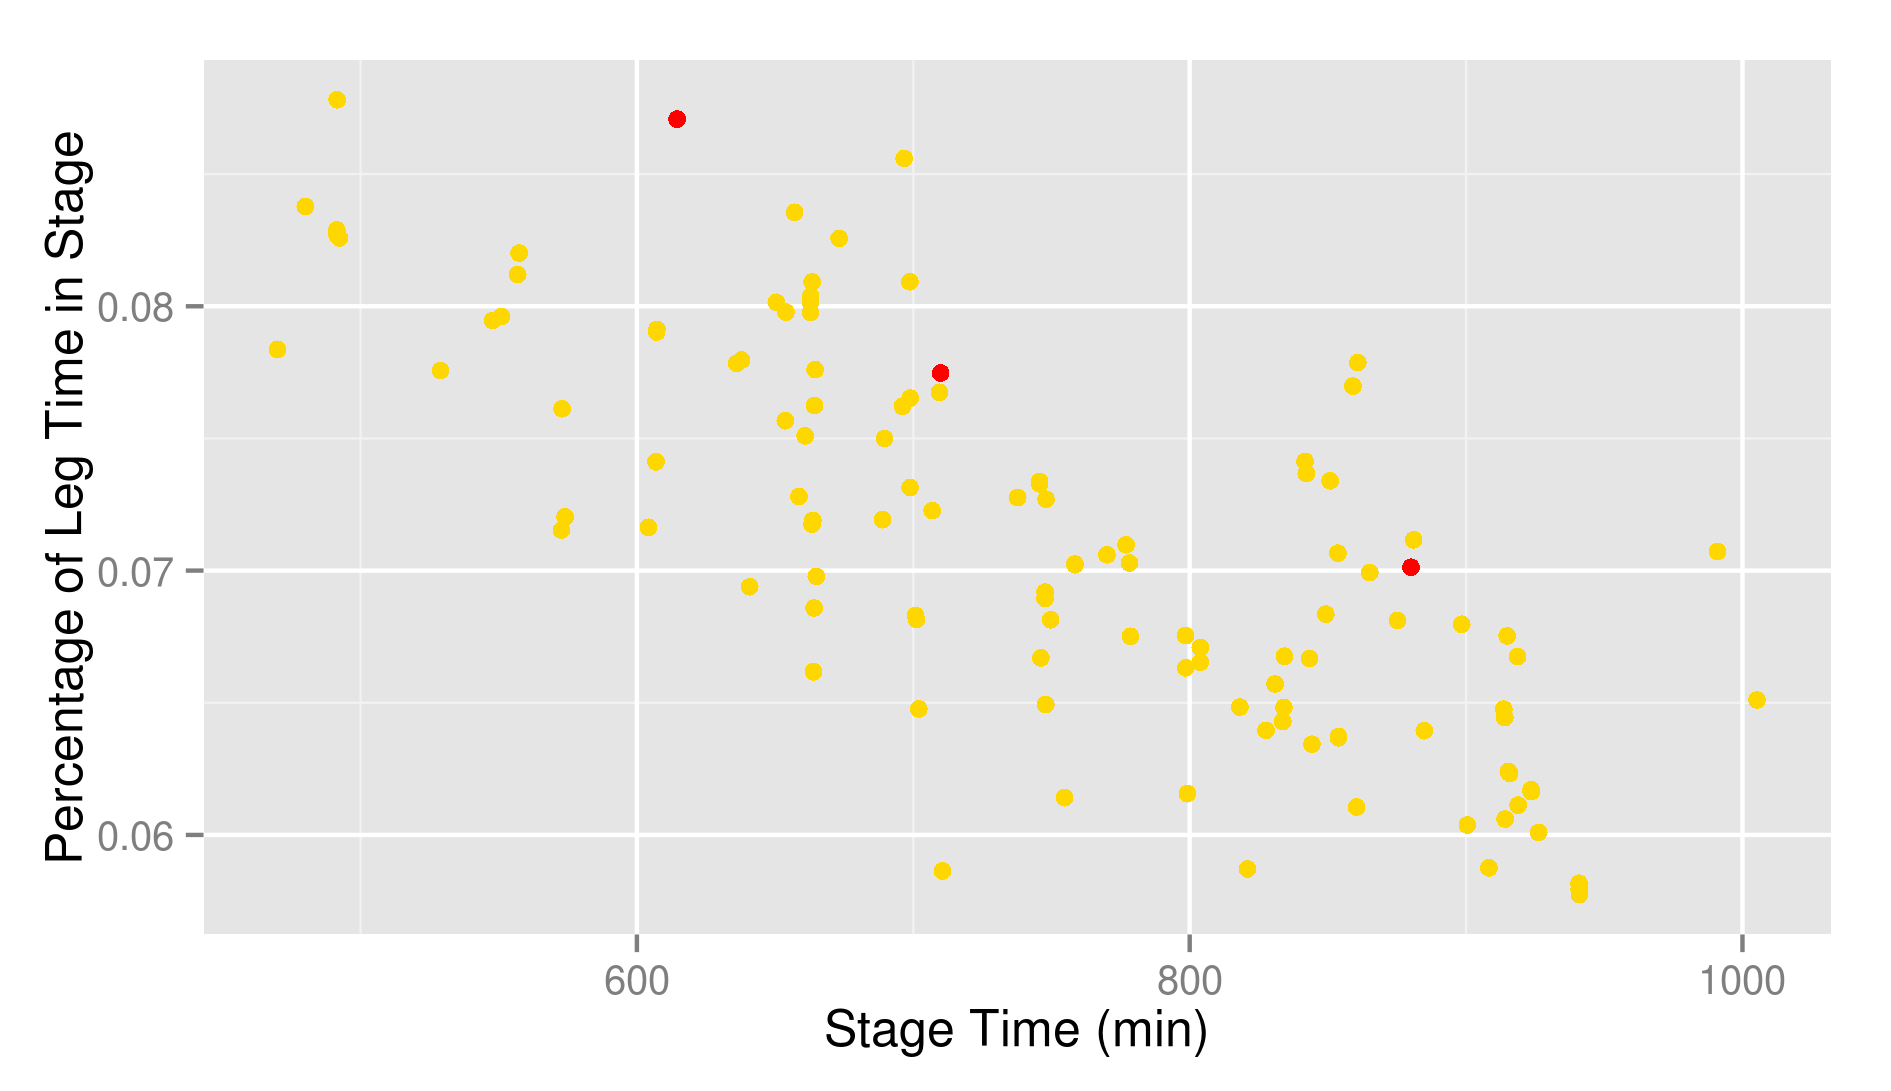
We see that the red dots are on the high side. This means that those runners were on the slow side on this leg. The conclusion is that this is no sound plan and you probably should follow the straight line like all the rest. You probably are not very surprised by that result.
Leg 4
The fastest time was run by André Jonsson with 36.0 minutes.
The median time was 53.4 minutes.
Everyone took the obvious way, except for someone (Filip) who strayed north.

The red line is clearly different from the others. But when we look at the percentages needed for this leg we find a surprise.
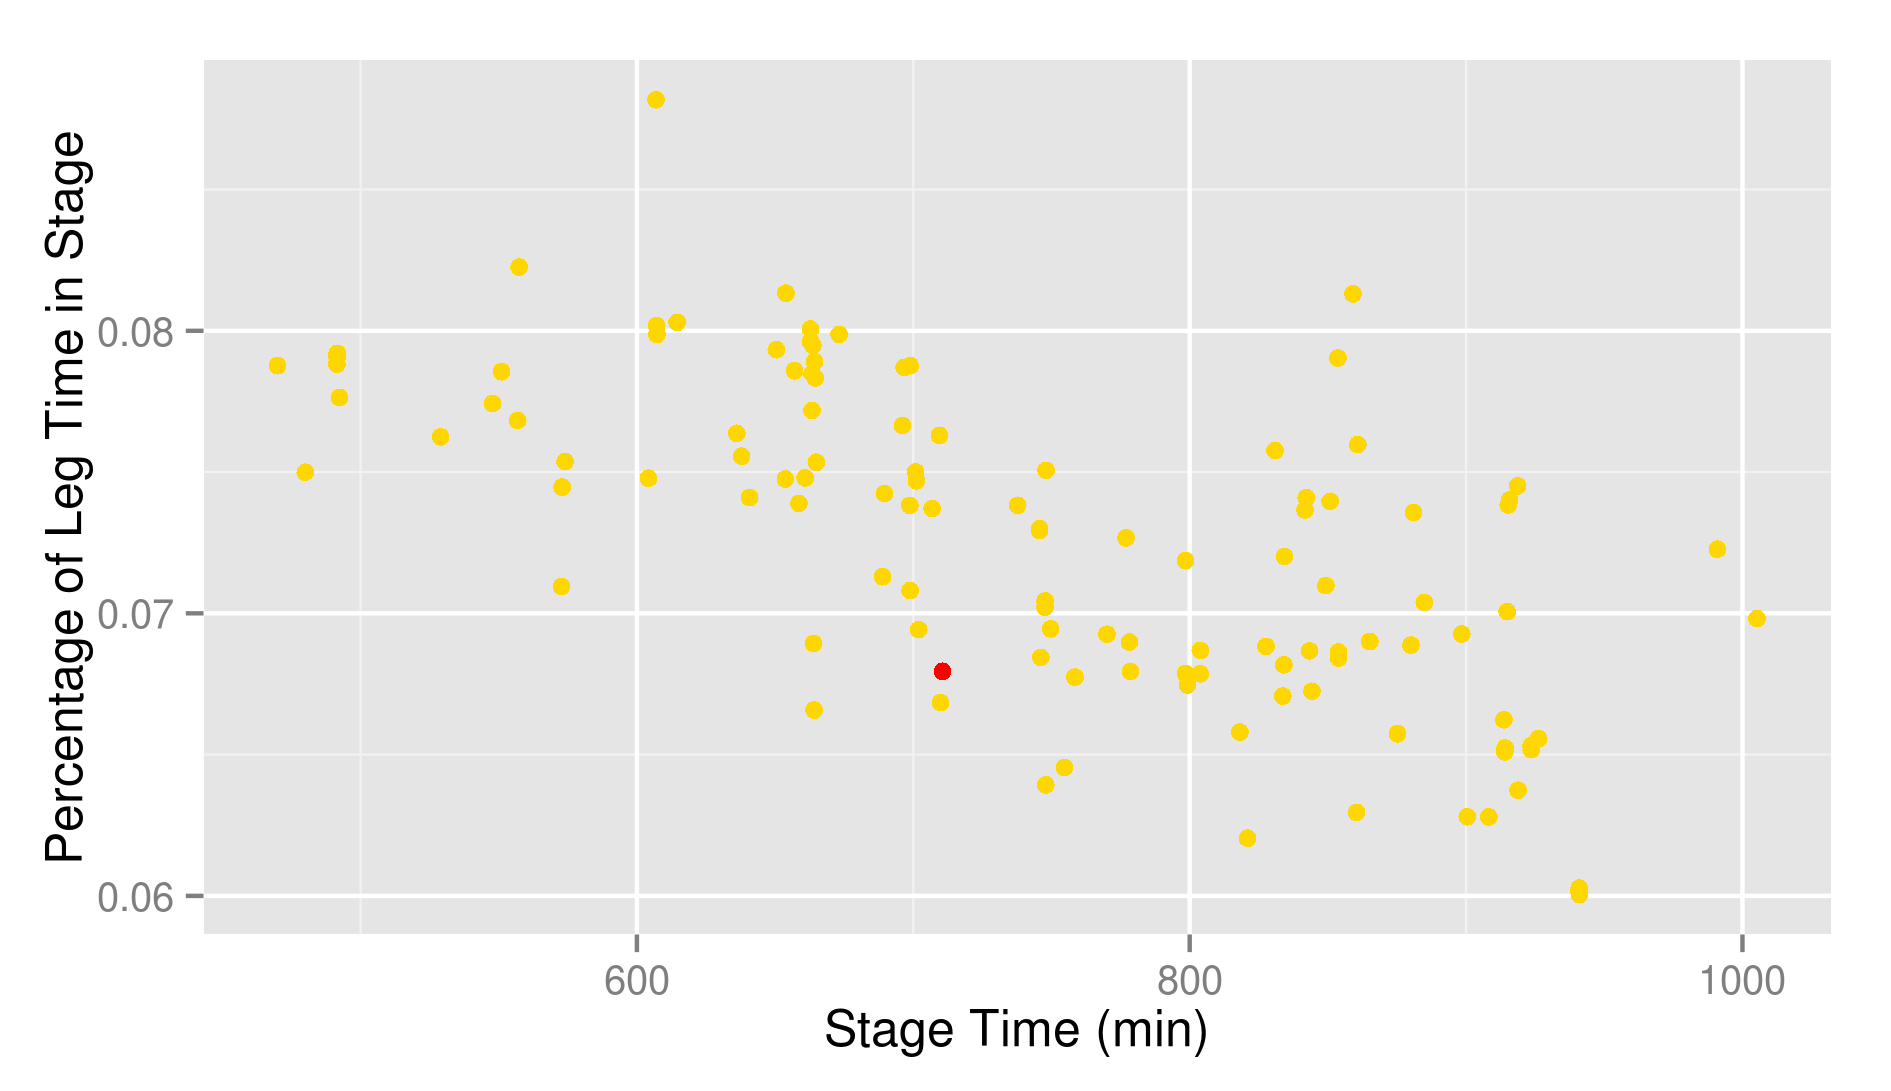
It was certainly not slower than the other runners. It looks a lot longer, so this surprises me. In fact I wonder if it are not simply some values where the GPS had a bad reception for some reason. It is always dangerous to draw conclusions from a single runner.
Leg 5
The fastest time was run by André Jonsson with 15.3 minutes.
The median time was 23.2 minutes.
Everyone took the obvious way.
Leg 6
The fastest time was run by André Jonsson with 8.5 minutes.
The median time was 13.5 minutes.
Everyone took the obvious way.
Leg 7
The fastest time was run by Edward Catmur with 8.2 minutes.
The median time was 12.8 minutes.
Everyone took the obvious way, except for André Jonsson. He started along the NW ridge, before backtracking and continuing along the correct ridge. It is worth remarking that he spent 23.3 minutes on this leg, against 9.2 for Jim. Knowing that he came second at the finish, only 11 minutes behind Jim, it looks like he lost the stage at this point. It is of course hard to say how race dynamics would have changed, but this was probably the most decisive moment of the race. Here, a two minute lag became a sixteen minute gap.
Leg 8
The fastest time was run by André Jonsson with 12.5 minutes.
The median time was 20.2 minutes.
Everyone took the obvious way. Except a few people that started along the eastern ridge before correcting towards the south.
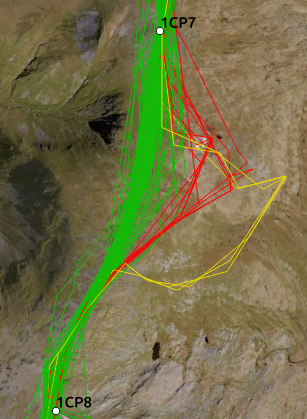
It is a bad plan. Seriously. Just keep an eye on your compass when running in the fog, will you.
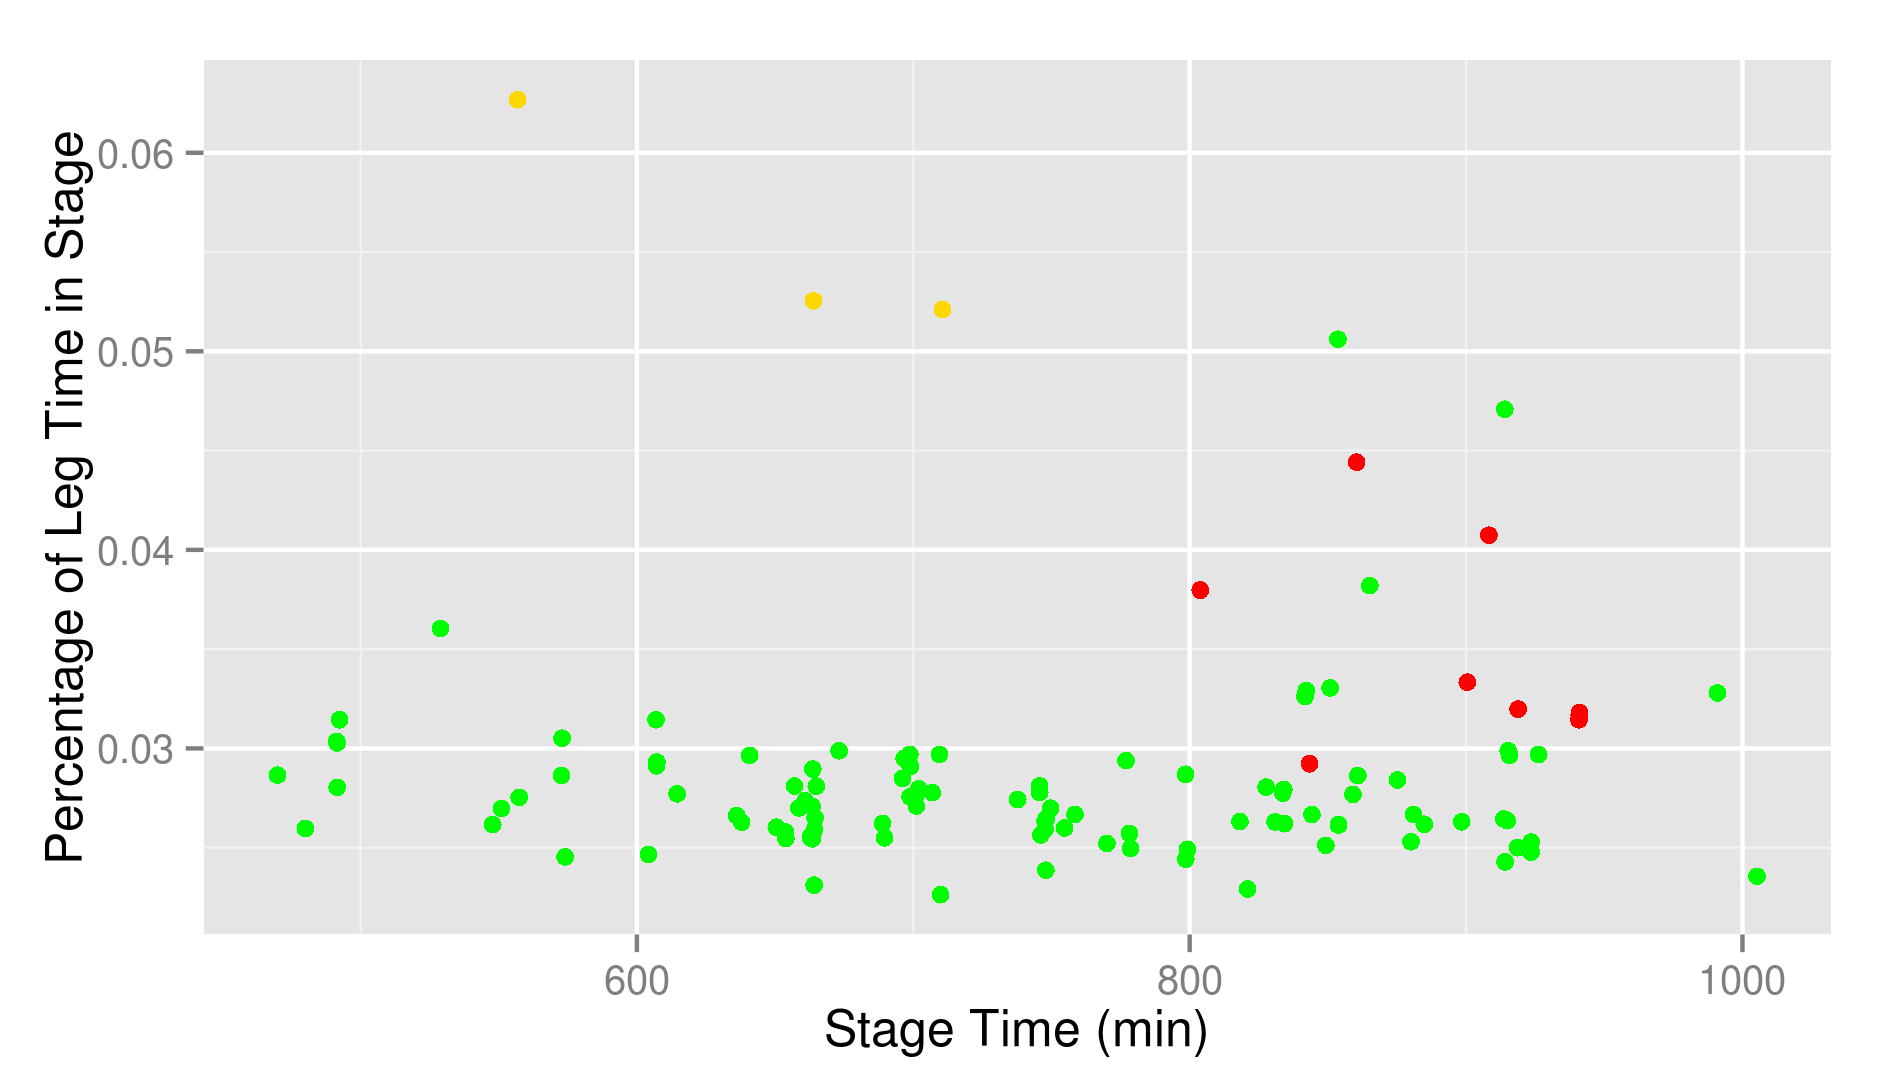
Especially the yellow line is bad. It takes about twice as long as the obvious green line. The most notable victim of this error was Alexander Beaven.
Leg 9
The fastest time was run by André Jonsson with 20.1 minutes.
The median time was 34.9 minutes.
Everyone took the obvious way. Again, there were some that started east before finding the correct ridge. Unsurprisingly, they lost time.
Leg 10
The fastest time was run by Jim Mann with 10.2 minutes.
The median time was 17.2 minutes.
Everyone took the obvious way.
Leg 11
The fastest time was run by André Jonsson with 23.0 minutes.
The median time was 44.6 minutes.
This is the point where things get interesting. During this leg, you run from the top of Pen Yr Ole Wen to the support point. There are two obvious options. Either you descend along the eastern ridge and go around the east side of the lake, or you take the southern ridge and go around the western edge of the lake. The latter option is shorter, but the first one provides faster running.
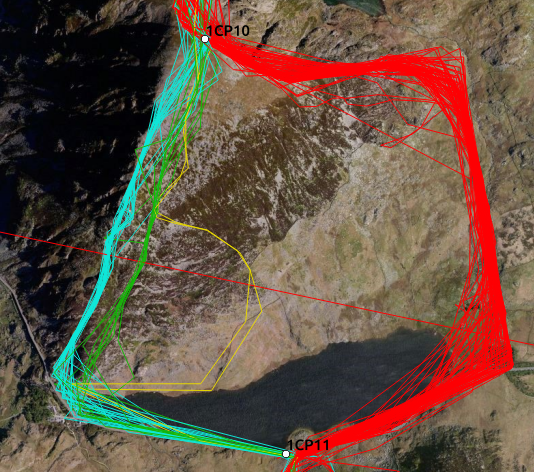
The eastern option (red) was the most popular with 84 runners taking it. Along the western tip of the lake came only 34 runners. Of those 34, there are two (yellow) that made a strange loop. It looks as if they were lost, but I have no idea if that is what actually happened. For those going to the west we see that there are two rather distinct lines. The easternmost one (green) was followed by 9 runners, while 23 runners went a bit more to the west (cyan). Now we all wonder what is the fastest option. Let’s see what we get when we plot the percentage of the time spent on this leg.
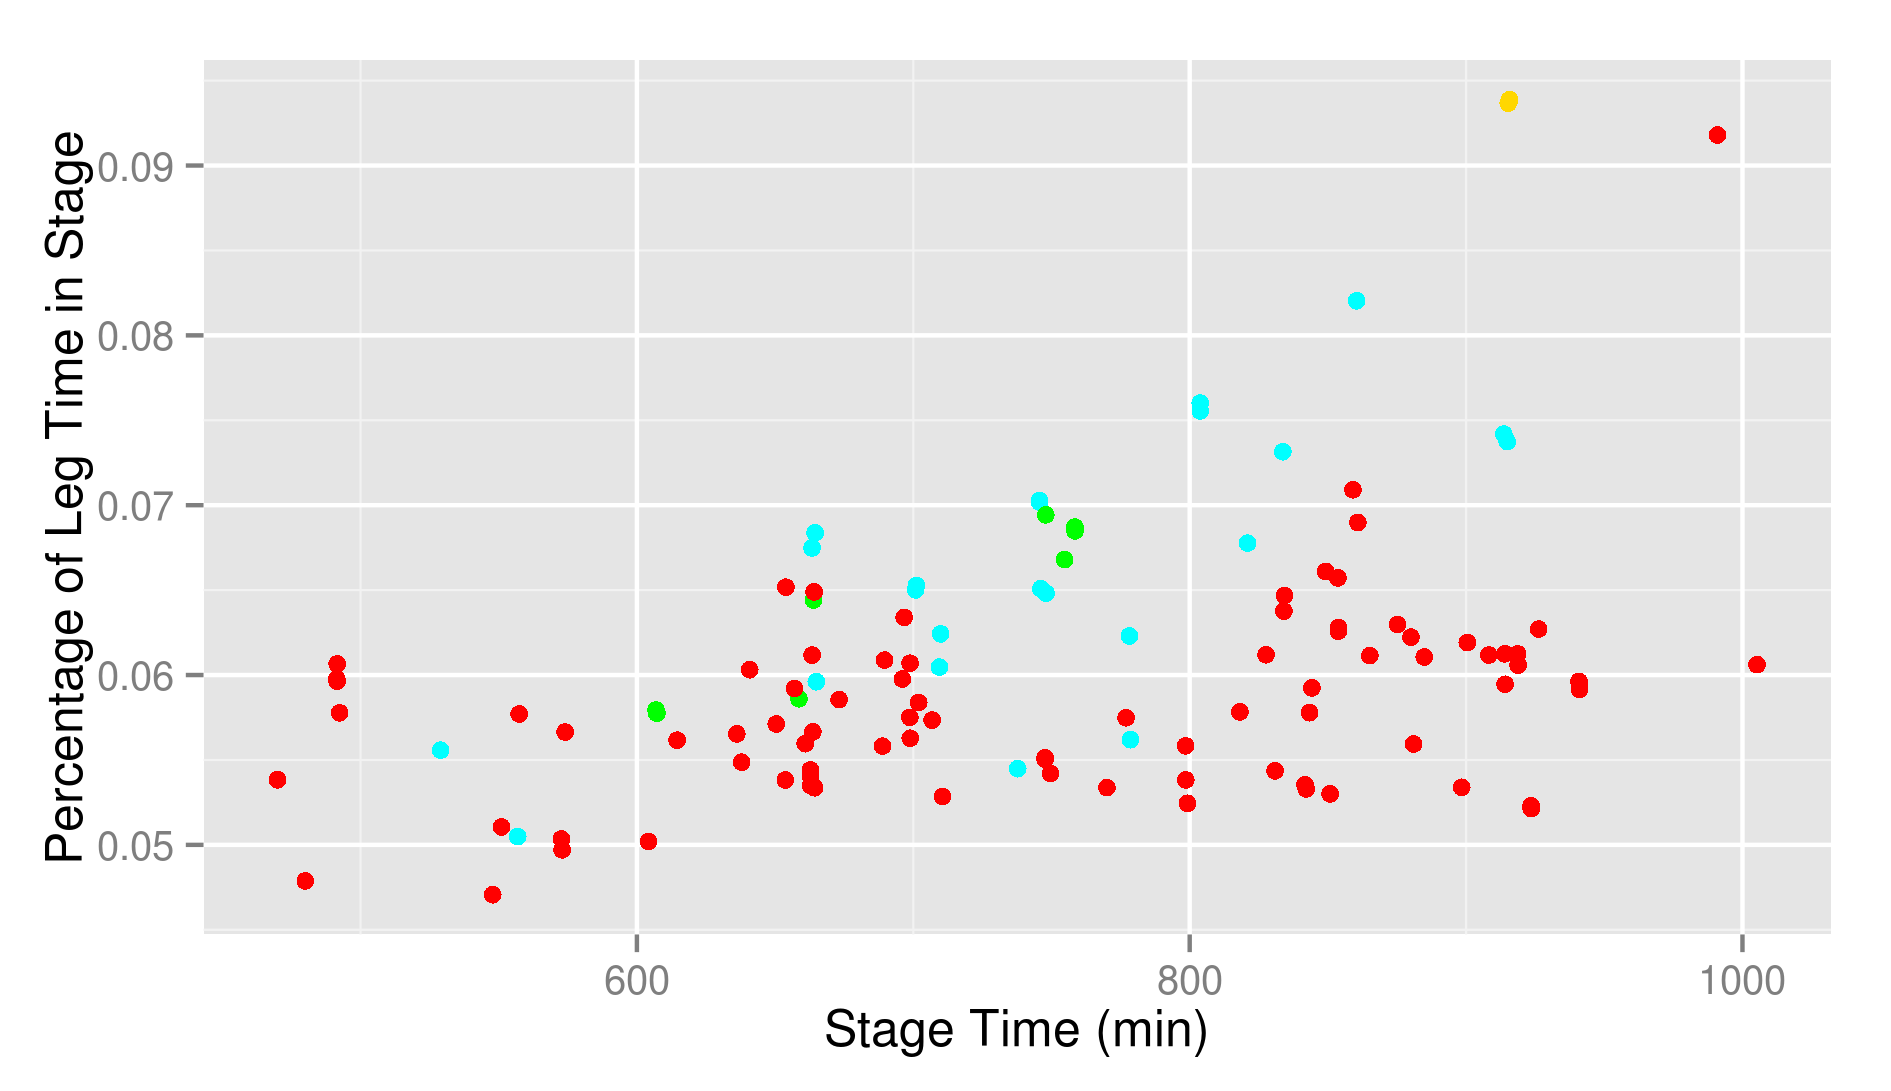
Interesting. The points of the western option appear to be systematically higher than the points of the eastern option. Indeed, if you run an ordinary t-test, you get a significant difference with a p-value of 0.000004. People choosing east spent on the average 5.8% of the stage on this leg against 6.5% for those going west. That is a difference of 3-4 minutes for the fastest runners and twice that for the slowest ones. My advice is obvious: take west. I’ll take east and gain a few minutes on you.
Then, is there a difference between both western options? The average for the green option is 6.3%, against 6.6% for the cyan option. But if you calculate a p-value, you get 0.26. That is rather bad, so I wouldn’t conclude that one is better than the other.
Leg 12
The fastest time was run by Jasmin Paris with 36.0 minutes.
The median time was 62.0 minutes.
One thing to keep in mind is that this is the leg following the support point. Time spent in the support point will be included in this stage time. My assumption is that this doesn’t matter for our analysis, but I’m not entirely sure about that.
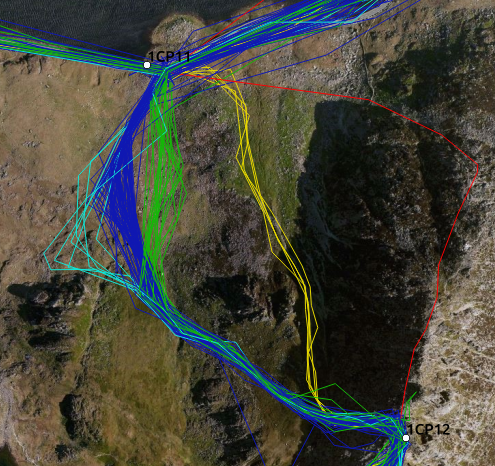
I thought the route was obvious. You just follow the path a while and then turn left and head straight for the summit of Tryfan (blue). This is what most (84) people did. But there are some original choices. Some people (21) started south before turning a little SW and joining the main group (green). Then, there were some (7) that went too far along the path to the SW before turning towards Tryfan (cyan). A few runners (5) didn’t care about paths and went straight to the summit of Tryfan (yellow). And finally, one runner approached Tryfan from the north instead of the west (red). A lot of options and of course we would like to know which one is the best.
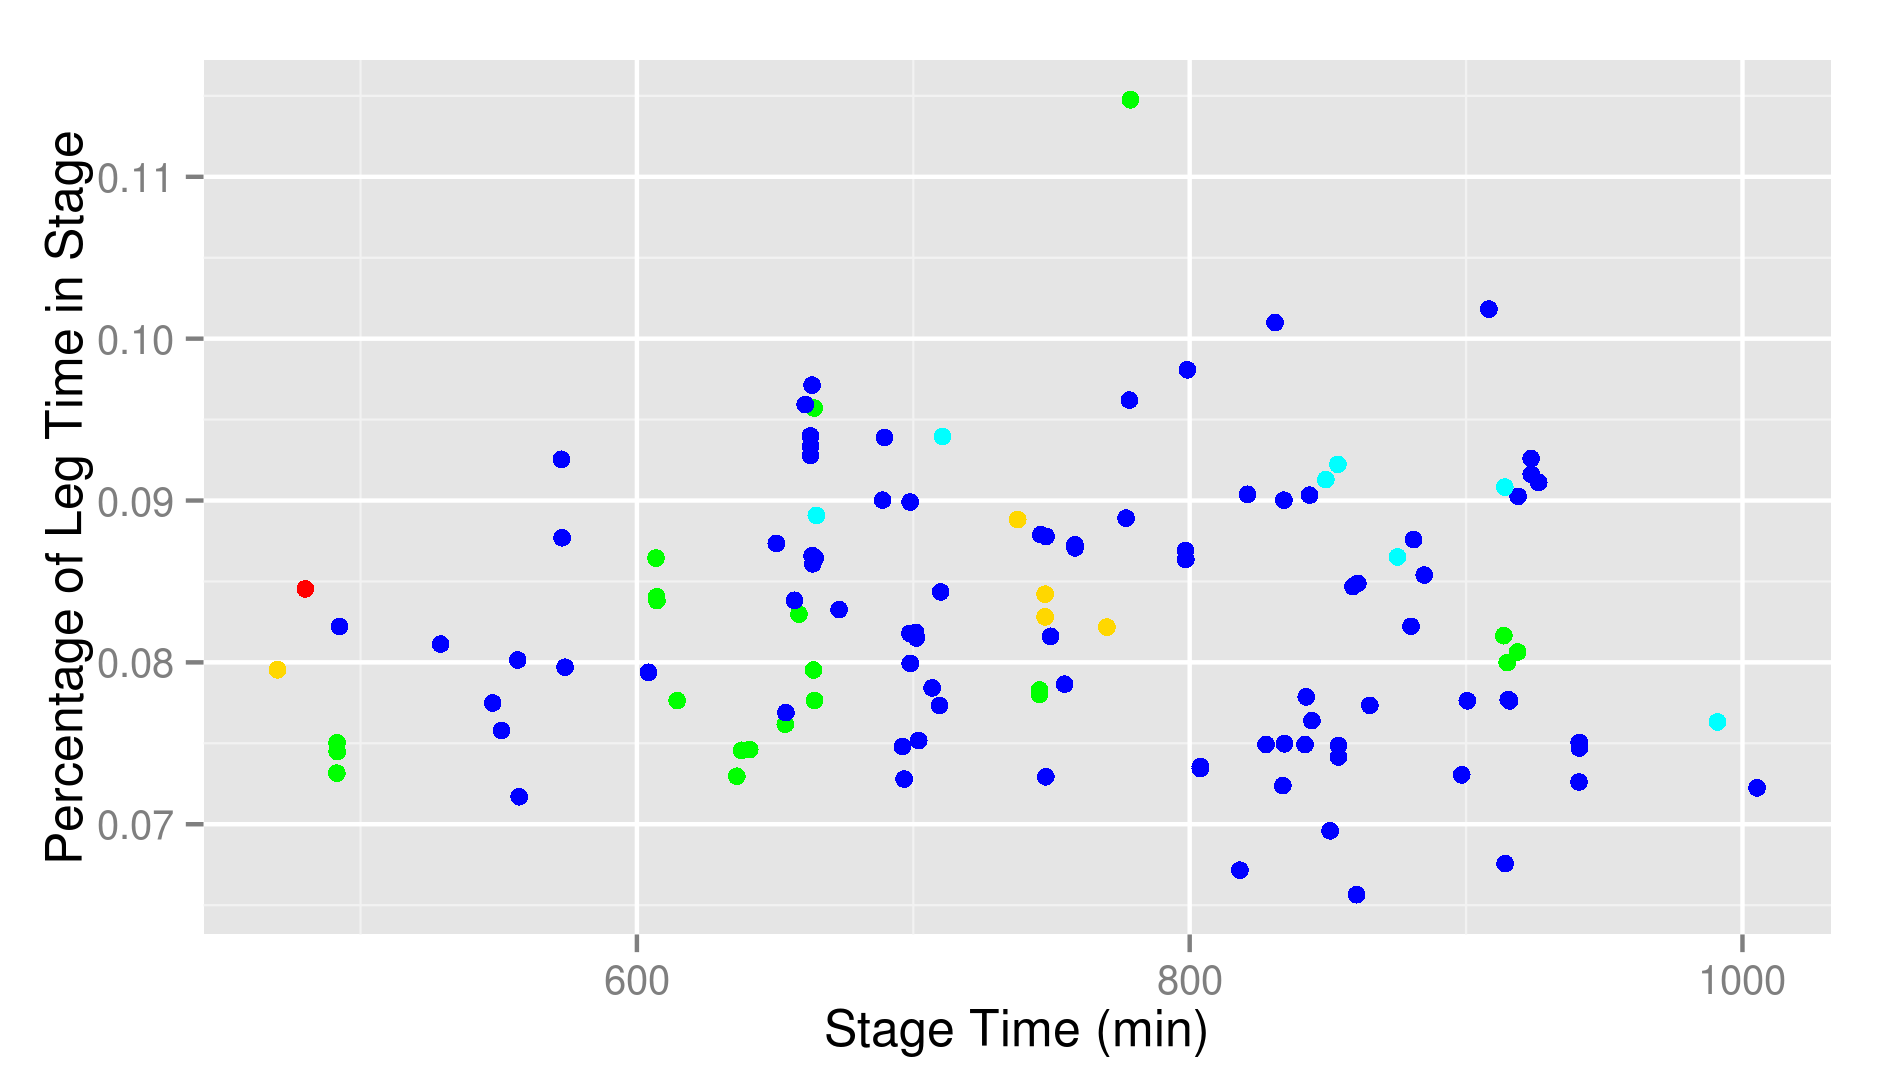
Well, this is less clear than what we had at the previous leg. I can tell that you are not getting any significant differences out of this. Even without adjustment for multiple testing (aka sherry picking) only one of the differences is significant. We can not get any strong conclusions from that. From the plot, I would say that the green option looks the most promising. I think I’ll try to find that one next time I run there. Finally, I’m a bit surprised how fast the red approach from the north is. OK, one data point is not very much, but it looks an awful long way on the map. André (who took that option) was only three minutes slower than Jim. Which might or might not be explained by a difference in time spent in the aid station. I’d love to see some more data on that option.
Leg 13
The fastest time was run by Steve Birkinshaw with 34.3 minutes.
The median time was 55.2 minutes.
You have to stay on the correct ridge. Some people didn’t. Blame it on the fog.
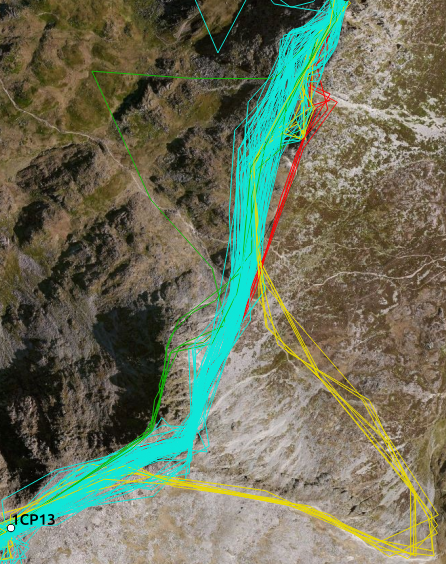
The line that was followed by most (101) runners is shown in cyan. An alternative (red) was chosen by four runners. It involves going a bit to the east. I’m honestly not sure if this is the line they actually run or if it is just an artefact of GPS reception. Then, we have the green line, which involves following the ridge to get to the Glyders, instead of going a bit around. This was done by five runners. Finally, there is the yellow line that looks suspiciously like getting seriously lost on the wrong ridge. Eight runners found themselves in that boat.
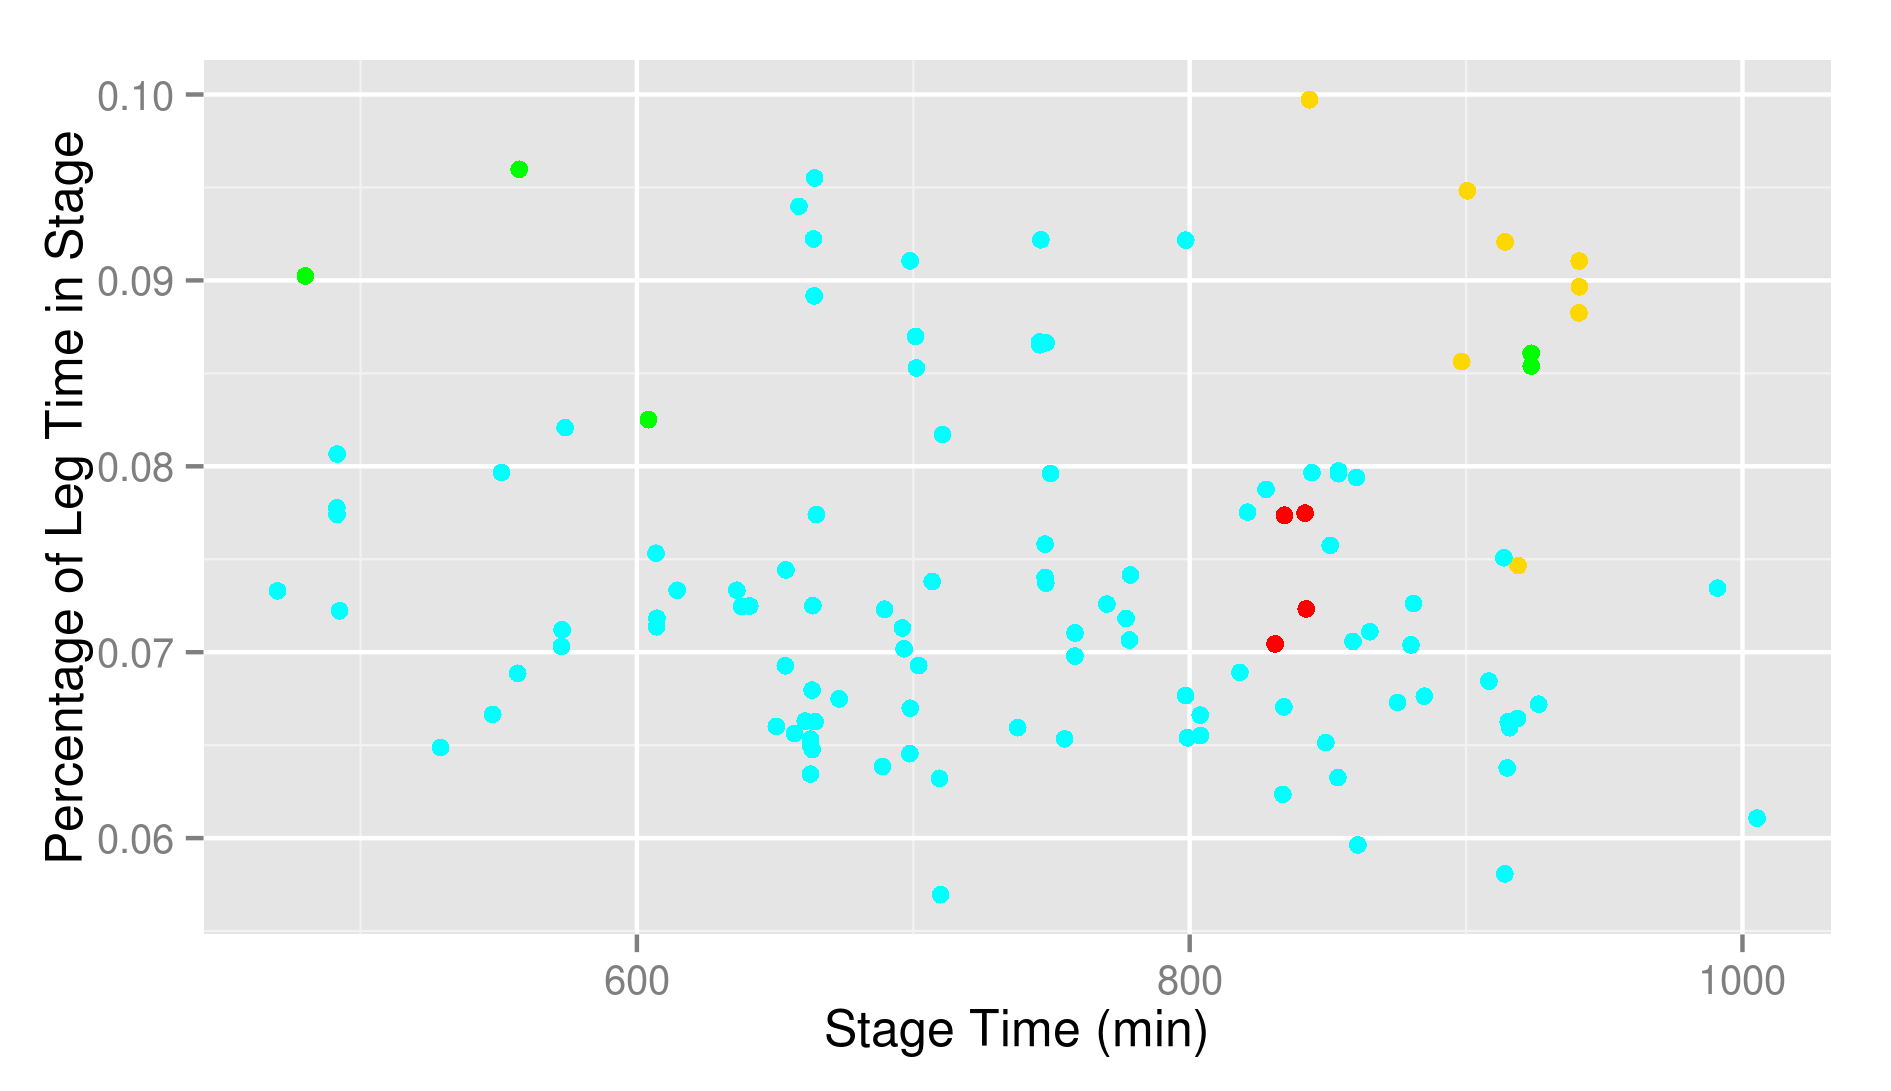
The picture is rather clear. Red and cyan are fine, green and yellow are slow. The notable victims of the green line are André Jonsson and Jez Bragg. This is the leg where André finally lost the stage. He lost here another nine minutes on Jim.
Leg 14
The fastest time was run by Jim Mann with 15.2 minutes.
The median time was 25.3 minutes.
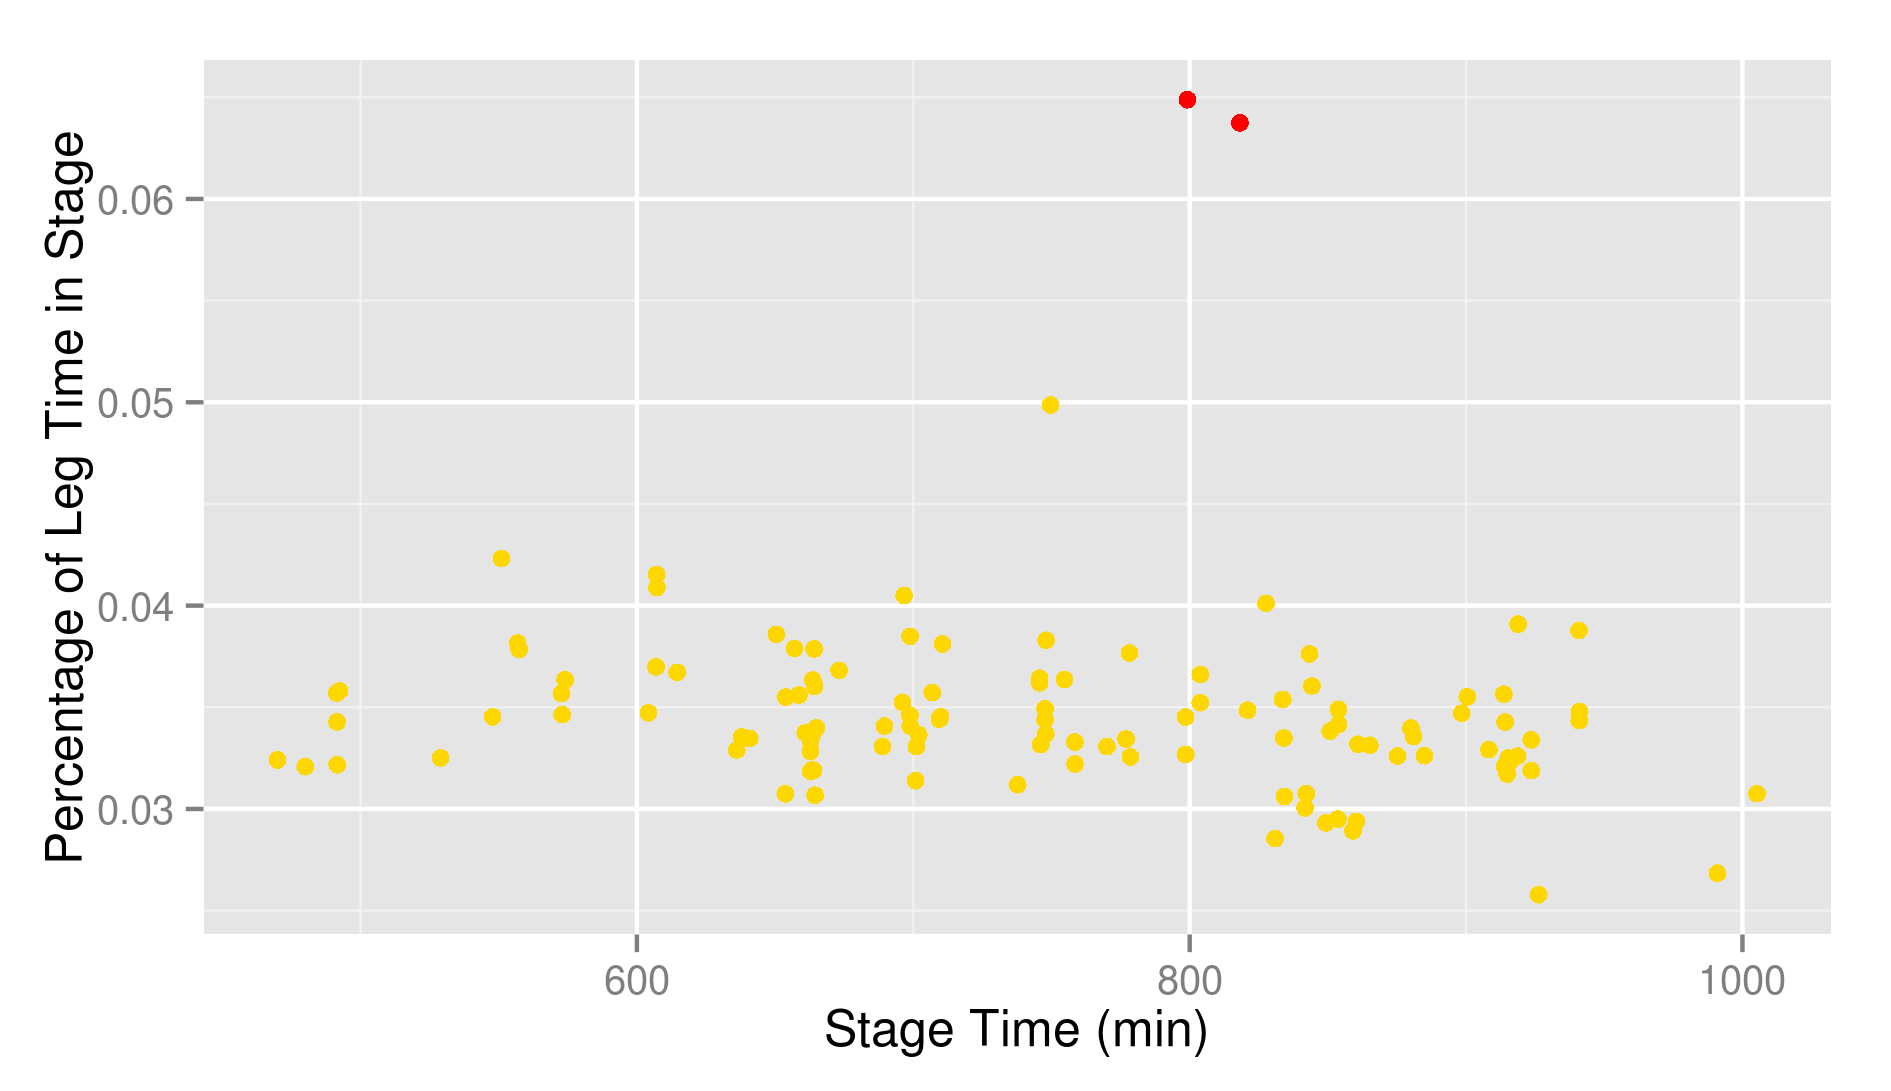
Everyone took the obvious ridge except for two runners who went too far south and had to make a right turn to find the summit (red line).
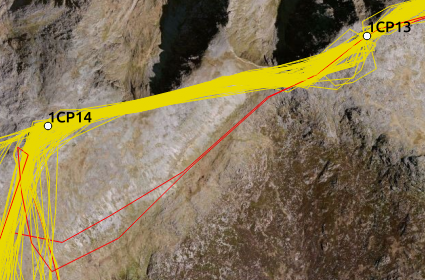
That is as bad as it sounds.
Leg 15
The fastest time was run by André Jonsson with 20.0 minutes.
The median time was 36.4 minutes.
This is another interesting leg. There are multiple options to descend to the Pen-y-Pass. You can see that a few lines were taken of which it is not immediately obvious which one would be the optimal one. I identified a few popular possibilities.
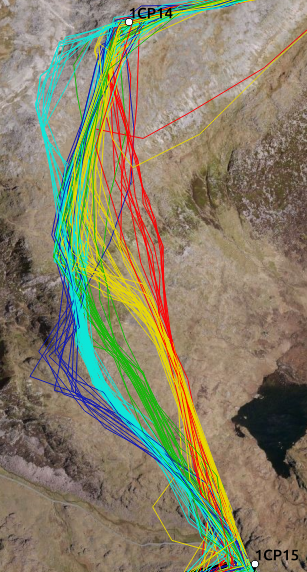
Most people went more or less south at first and after making the turn towards the Penn-y-Pass, three main lines are visible. Those are shown in yellow (29 runners), green (21 runners) and cyan (44 runners). Some people went a bit further south before turning towards the south-west, an option that is shown in blue (12 runners). Another possibility was coming straight down in a more or less straight line to the Penn-y-Pass (red, 12 runners). To be complete there was also someone who went straight for the road and then climbed to the Penn-y-Pass following the road. However, this runner dropped at the Penn-y-Pass, so I won’t consider this option in the analysis. This is what the plot looks like.
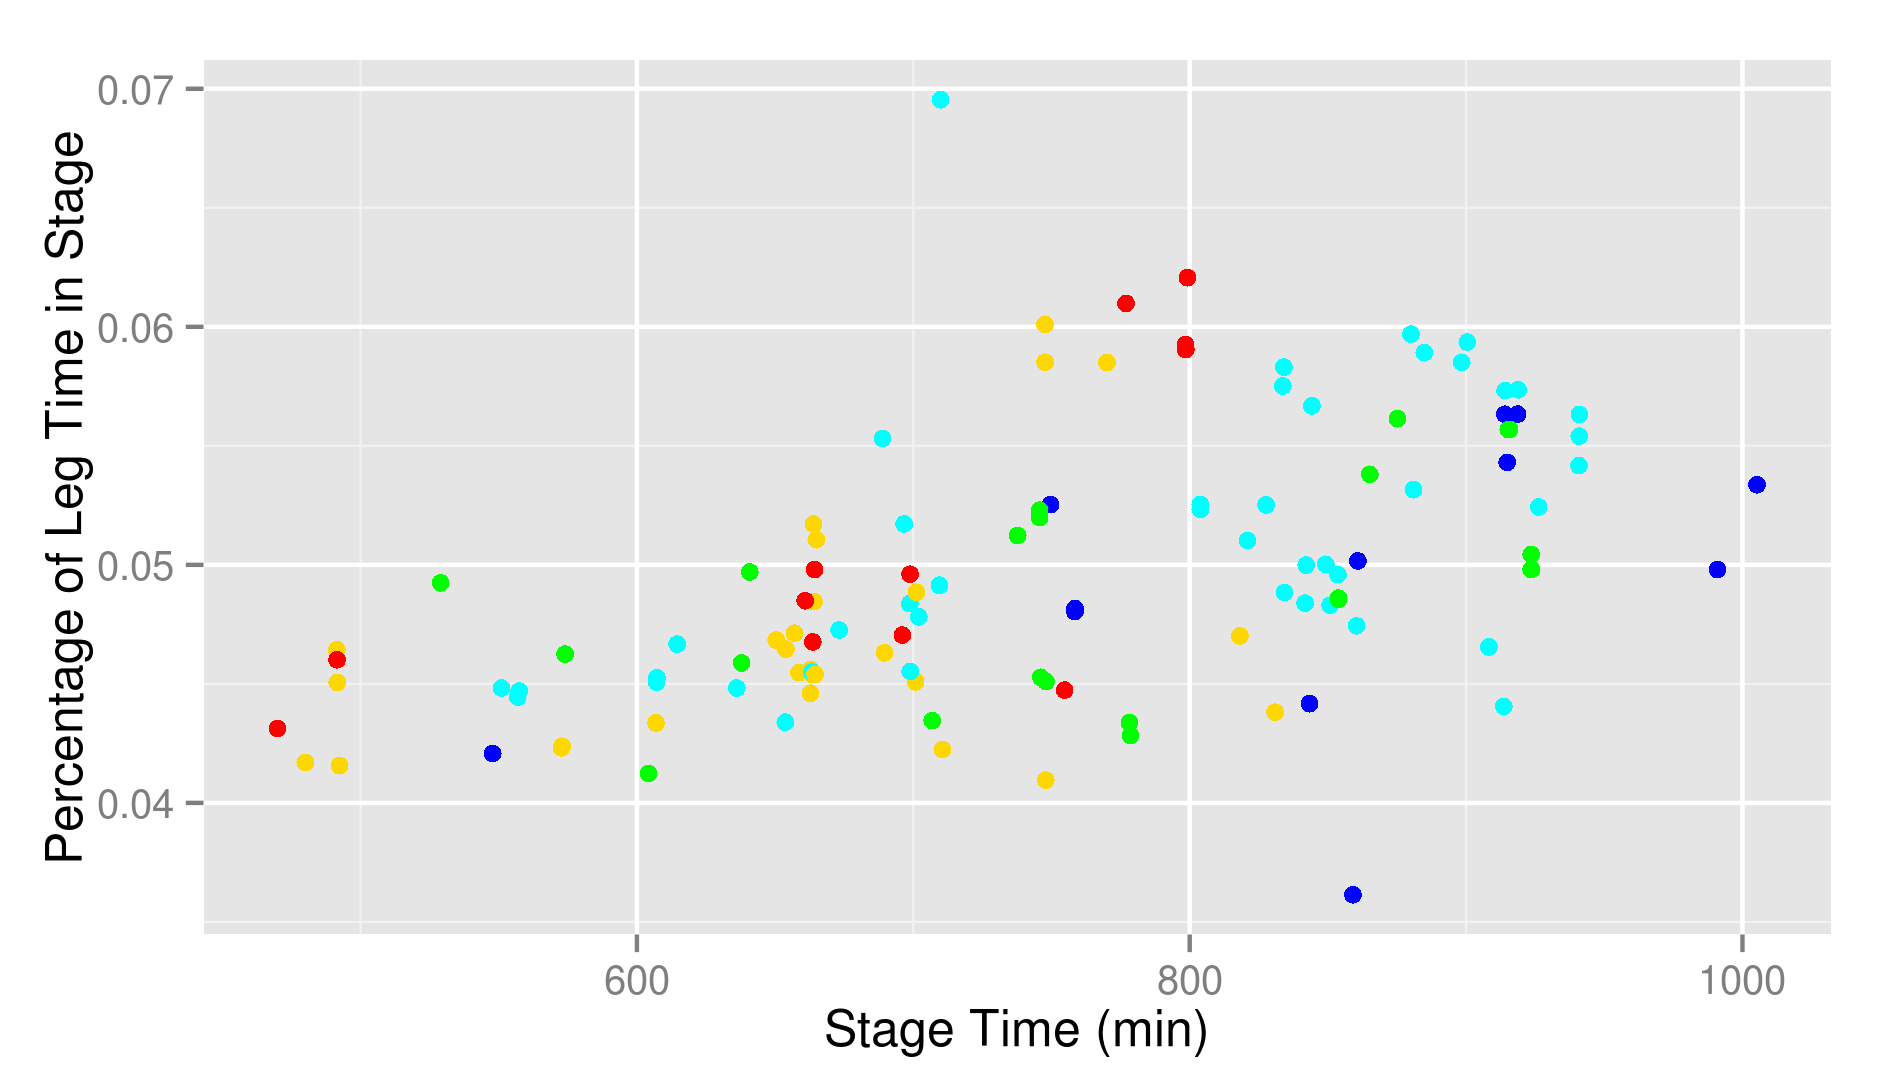
Lots of dots, lots of colours and no obvious winner or loser. The averages for the different options are 5.14% (red), 4.68% (yellow), 4.89% (green), 5.13% (cyan) and 4.93% (blue). The only two that are significantly different according to a pairwise t-test are yellow and cyan. All the rest, no, not really. But remember that this is one of the stages where the slope of the regression line was significant and we see that yellow is generally followed by faster runners than cyan. This makes it really troubling to obtain a meaningful conclusion. To conclude, we won’t draw any hard conclusions from it. According to me the most import thing is to pick a reasonable line and keep going. Just don’t start second-guessing your choice. Even if your choice is not the optimal one, differences with the other options are tiny and the influence of your own effort will dominate the differences.
Leg 16
The fastest time was run by André Jonsson with 40.5 minutes.
The median time was 70.3 minutes.
Everyone stayed on the rather obvious line or close to it.
Leg 17
The fastest time was run by André Jonsson with 22.7 minutes.
The median time was 42.5 minutes.
Here the obvious way is to follow the ridge again. There are paths a bit lower, but all options are too close to each other to make a distinction based on the tracks.
Leg 18
The fastest time was run by Jim Mann with 8.4 minutes.
The median time was 13.1 minutes.
Everyone took the obvious way. I have no idea what you would do otherwise.
Leg 19
The fastest time was run by Jim Mann with 23.4 minutes.
The median time was 46.5 minutes.
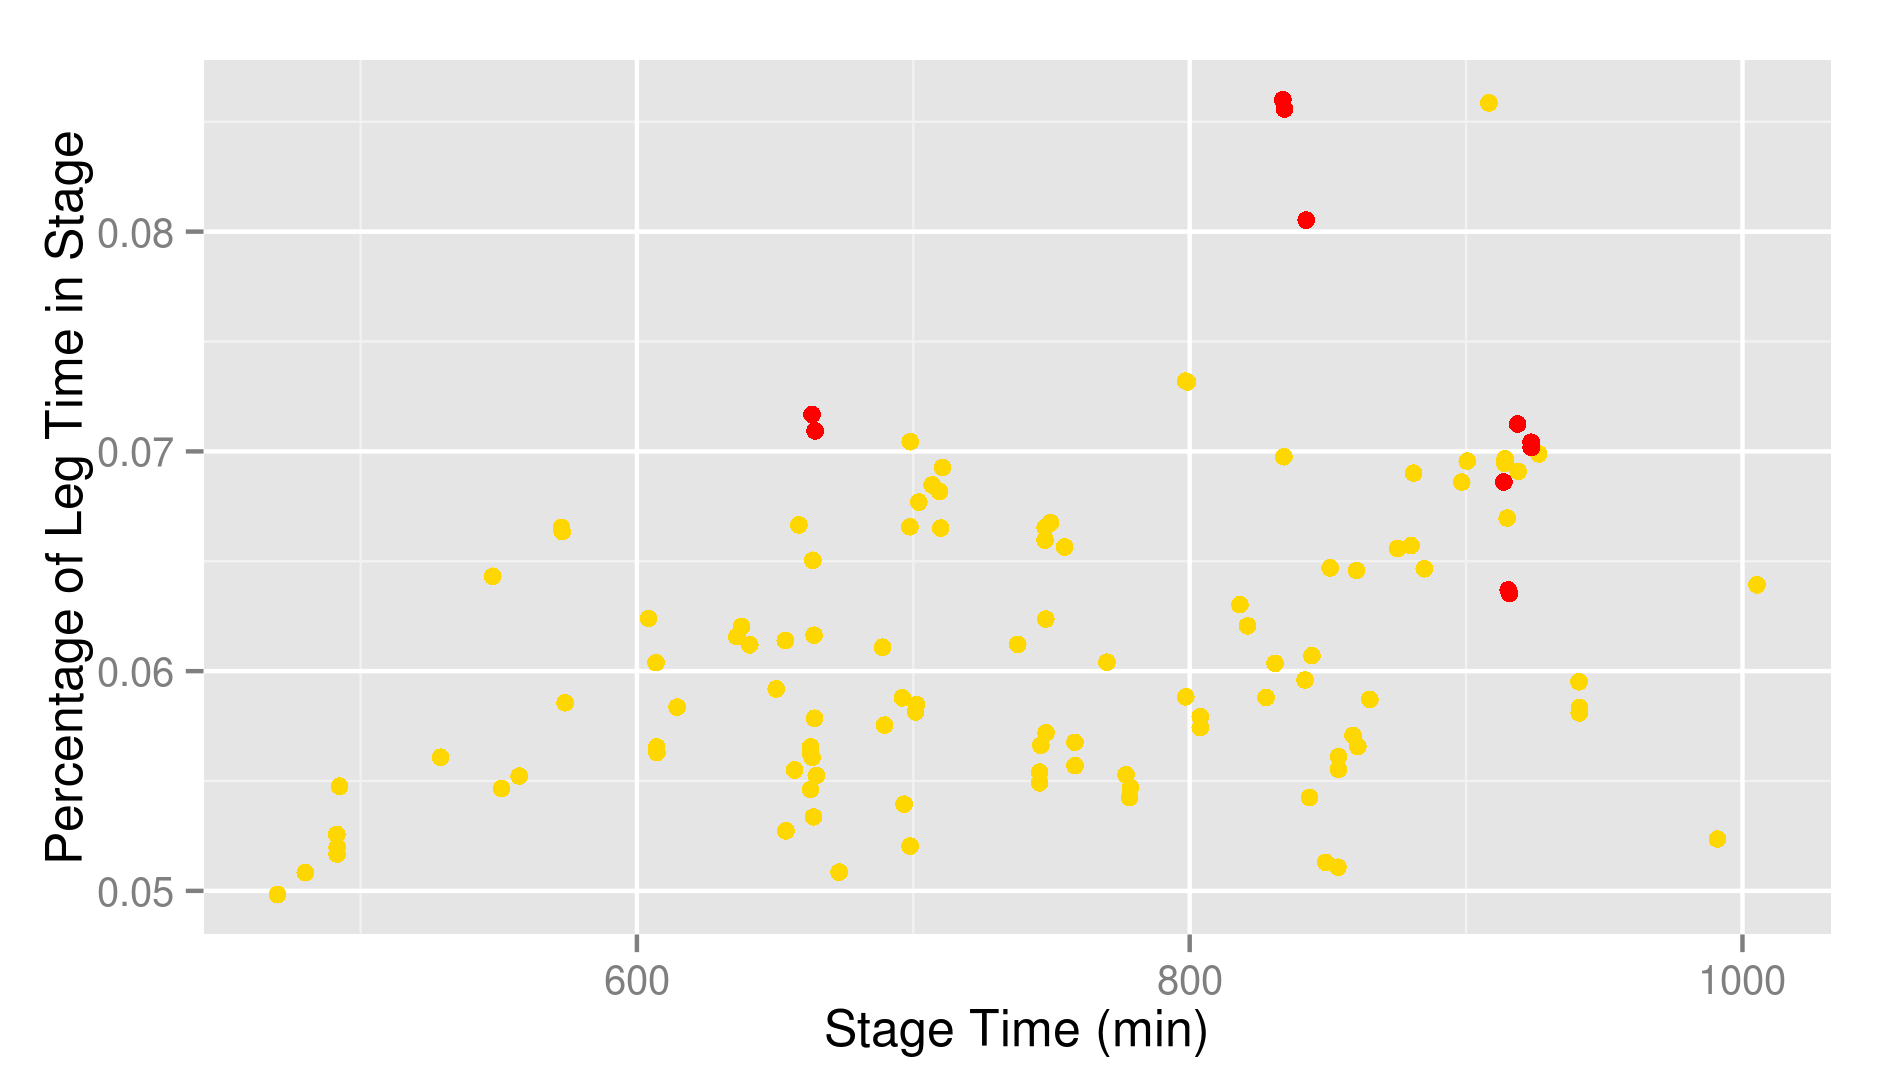
Some people went to fare south after the summit of Yr Wyddfa and had to backtrack to find the correct ridge.
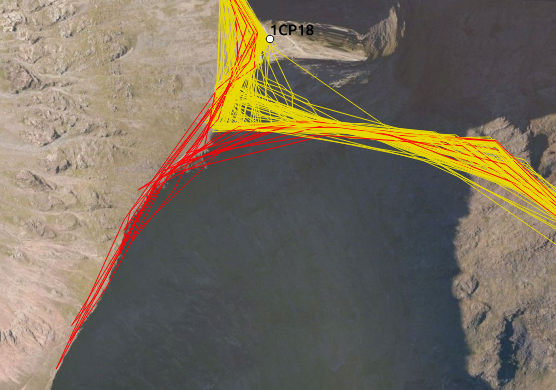
It comes probably as no surprise to anyone that erring is not a sound plan.
Leg 20
The fastest time was run by Konrad Rawlik with 20.3 minutes.
The median time was 37.0 minutes.
Here, there are without a doubt different lines that can be taken, but they are all parallel and close together. The resolution of the tracks is not enough to distinguish them really. Some are probably better than others, but I can’t tell based on the tracks.
Leg 21
The fastest time was run by Edward Catmur with 17.7 minutes.
The median time was 33.3 minutes.
Again, there are certainly different lines, but it is very hard to distinguish them based on the tracking data. They are simply to close together. My main advise is to stay on that wide path once you found it. A few people went straight where it switchbacks down and those where rather slow.
Leg 22
The fastest time was run by André Jonsson with 5.0 minutes.
The median time was 9.4 minutes.
The leg is way too short to tell different options apart. I’m not even trying to.

Leg 12, yellow option. I mad a navigation mistake and started like this on the descent during the V3k last week. There’s actually some kind of a path there. It is obviously rather steep and I wasn’t very quick in the descent as it is not really rolling, but in the uphill I guess it could be a fair option too.
Is die rode optie niet de standaard downhill versie die ook gebruikt wordt met de 14 peak (of 15) pogingen?
Via de westgully? Ligt wel een hele grote hoop puin in dat ding maar naar boven gaat ook wel … Vrij snelle manier zelfs, of het sneller is geen idee.
This is absolutely brilliant! Just one question re: Pen yr Ole Wen – should “People choosing west spent on the average 5.8% of the stage on this leg against 6.5% for those going west.” actually be “People choosing *east*…”?
Good catch. I’ve corrected it.
Totally brilliant detail….and very interesting . Good to see what Ally Beaven was up to in Leg 8! ha ha
Thanks.