Day 2 of the Dragon’s Back Race starts with Cnicht and ends near Dolgellau. It was a very warm day.
The entire stage
The fastest time was run by Jim Mann with 480.8 minutes.
The median time was 804.8 minutes.
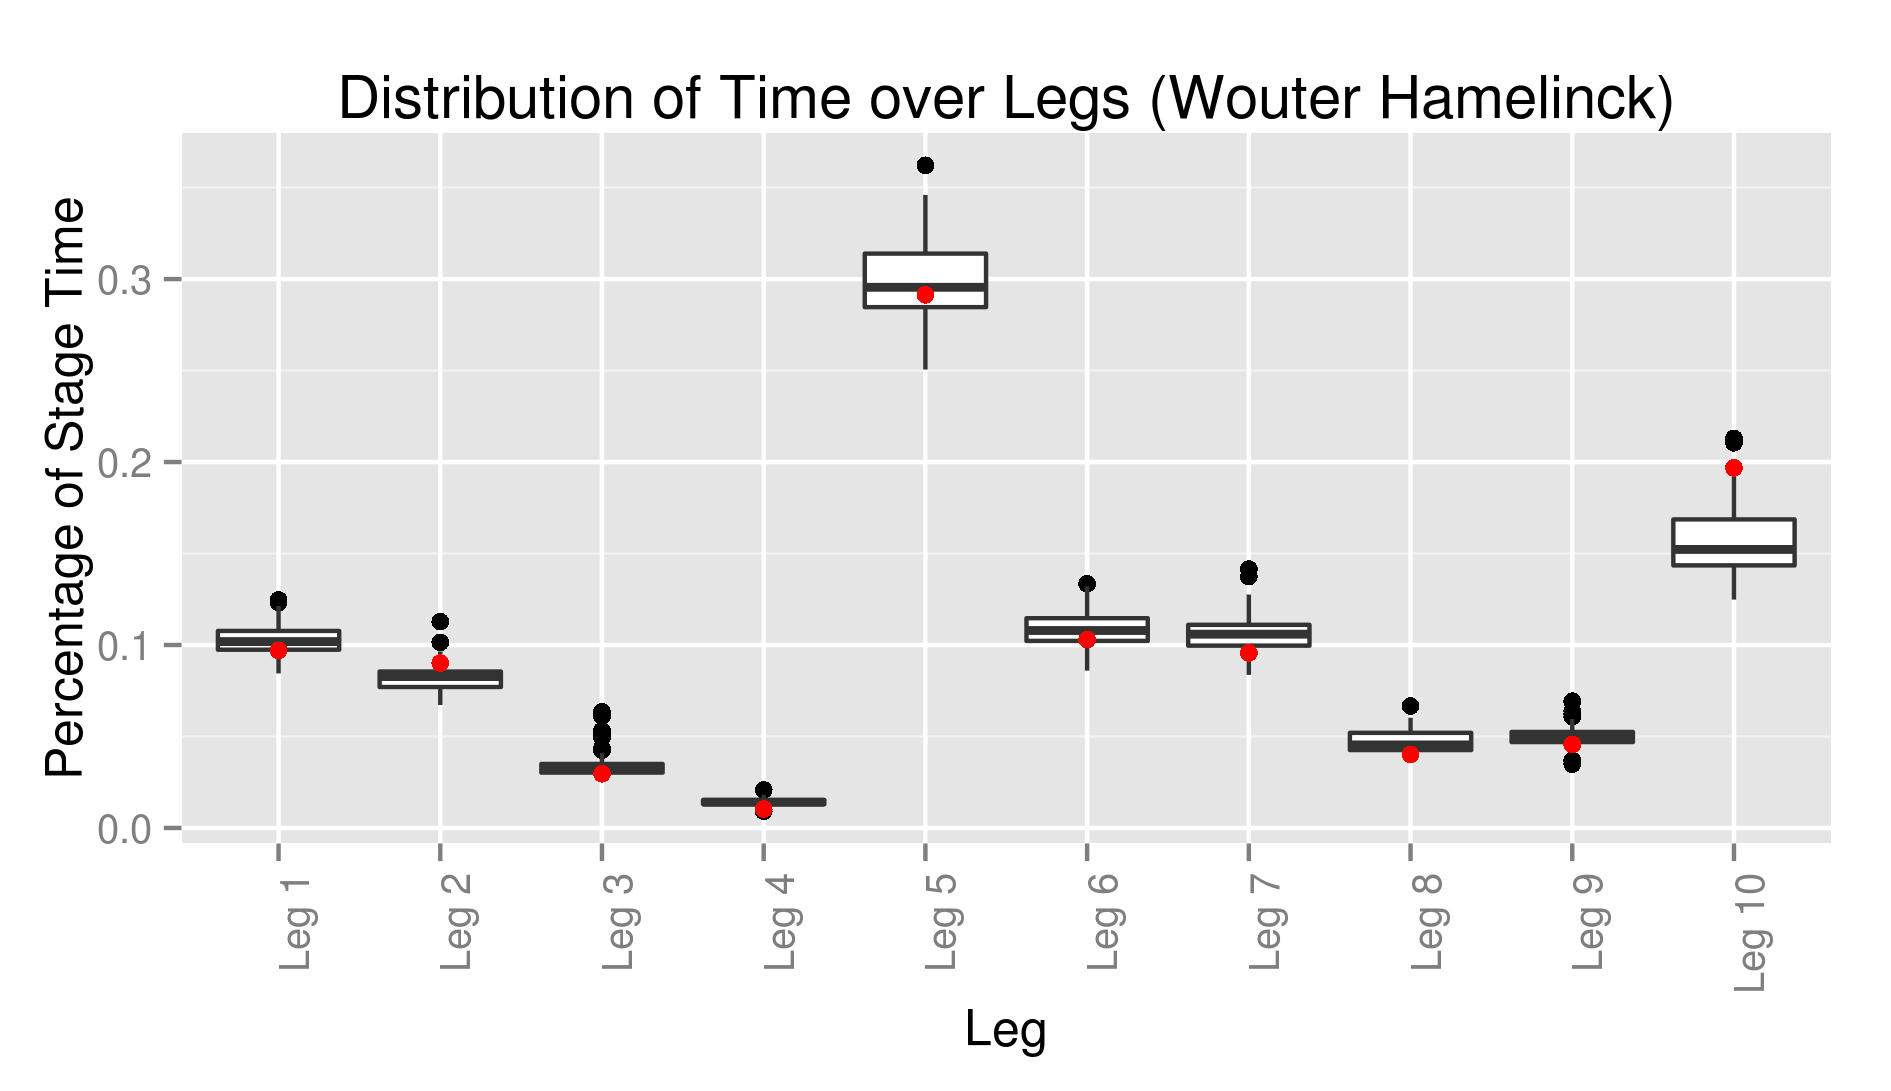
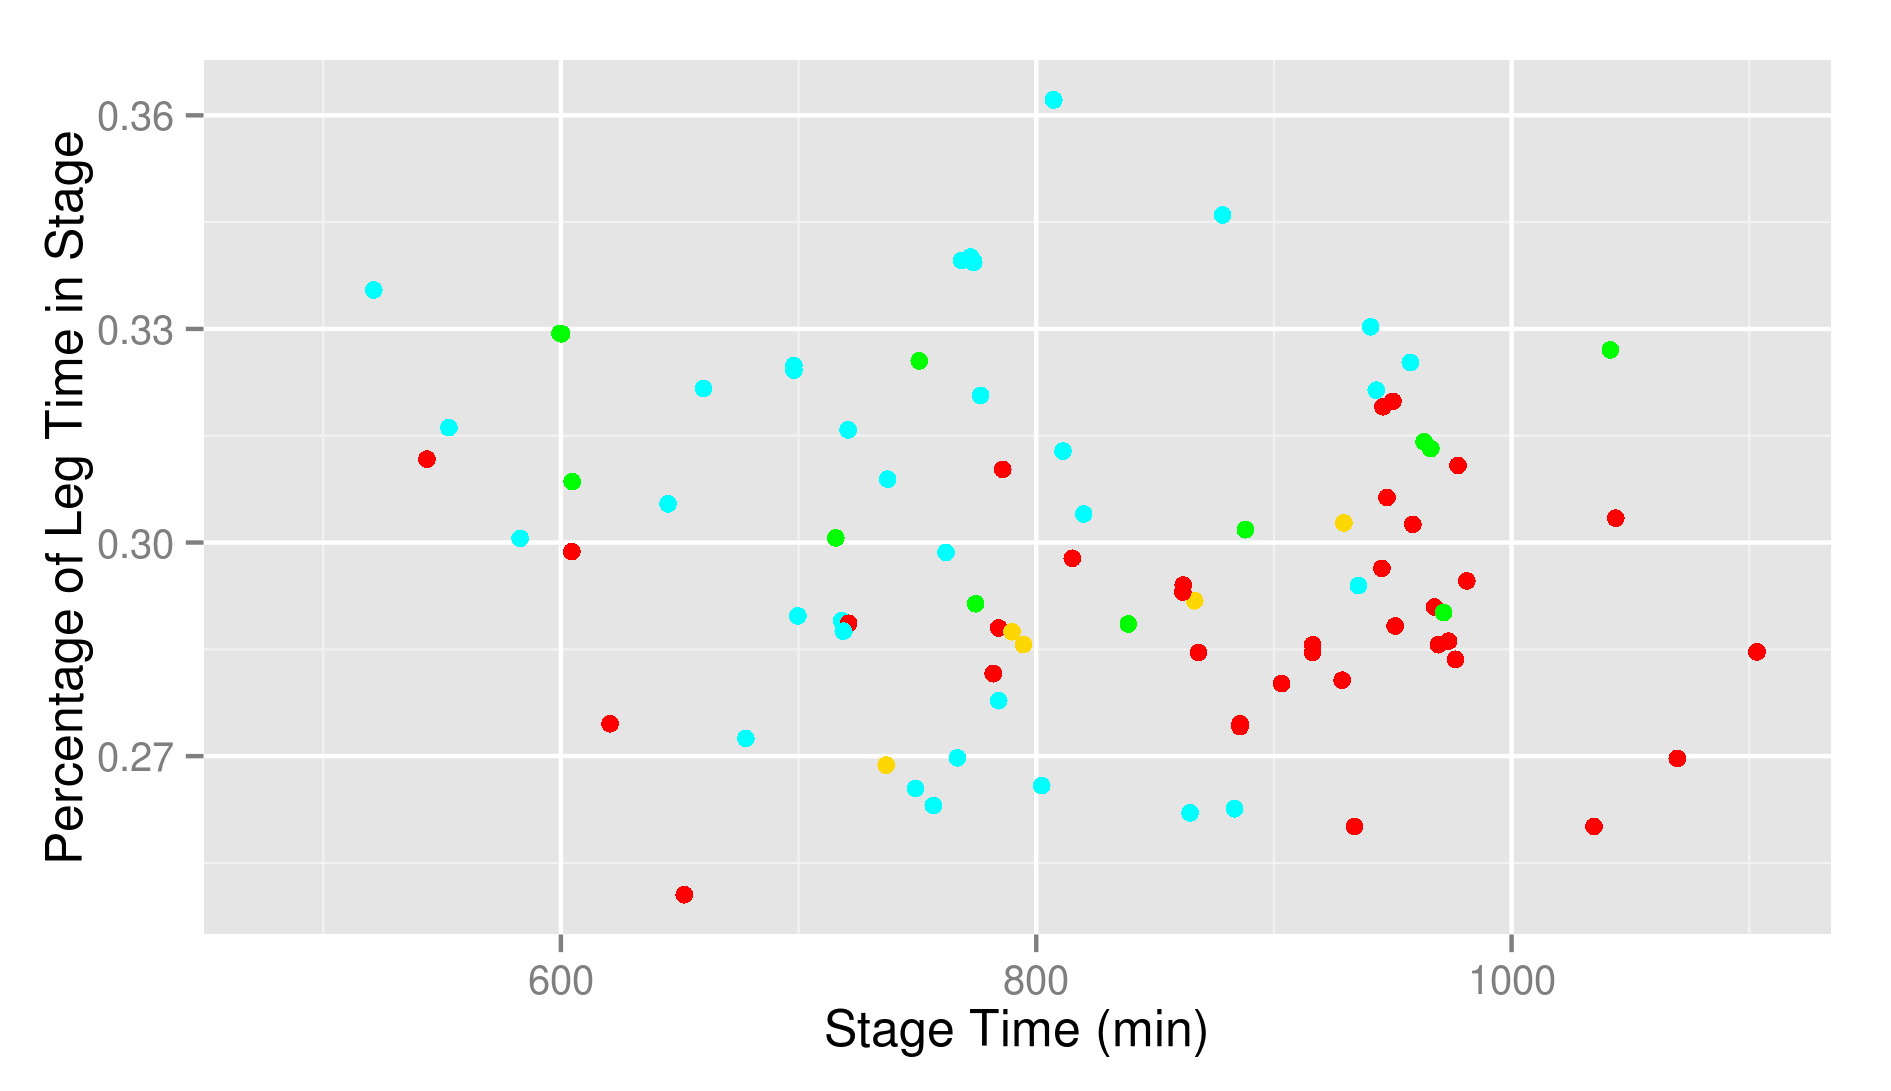
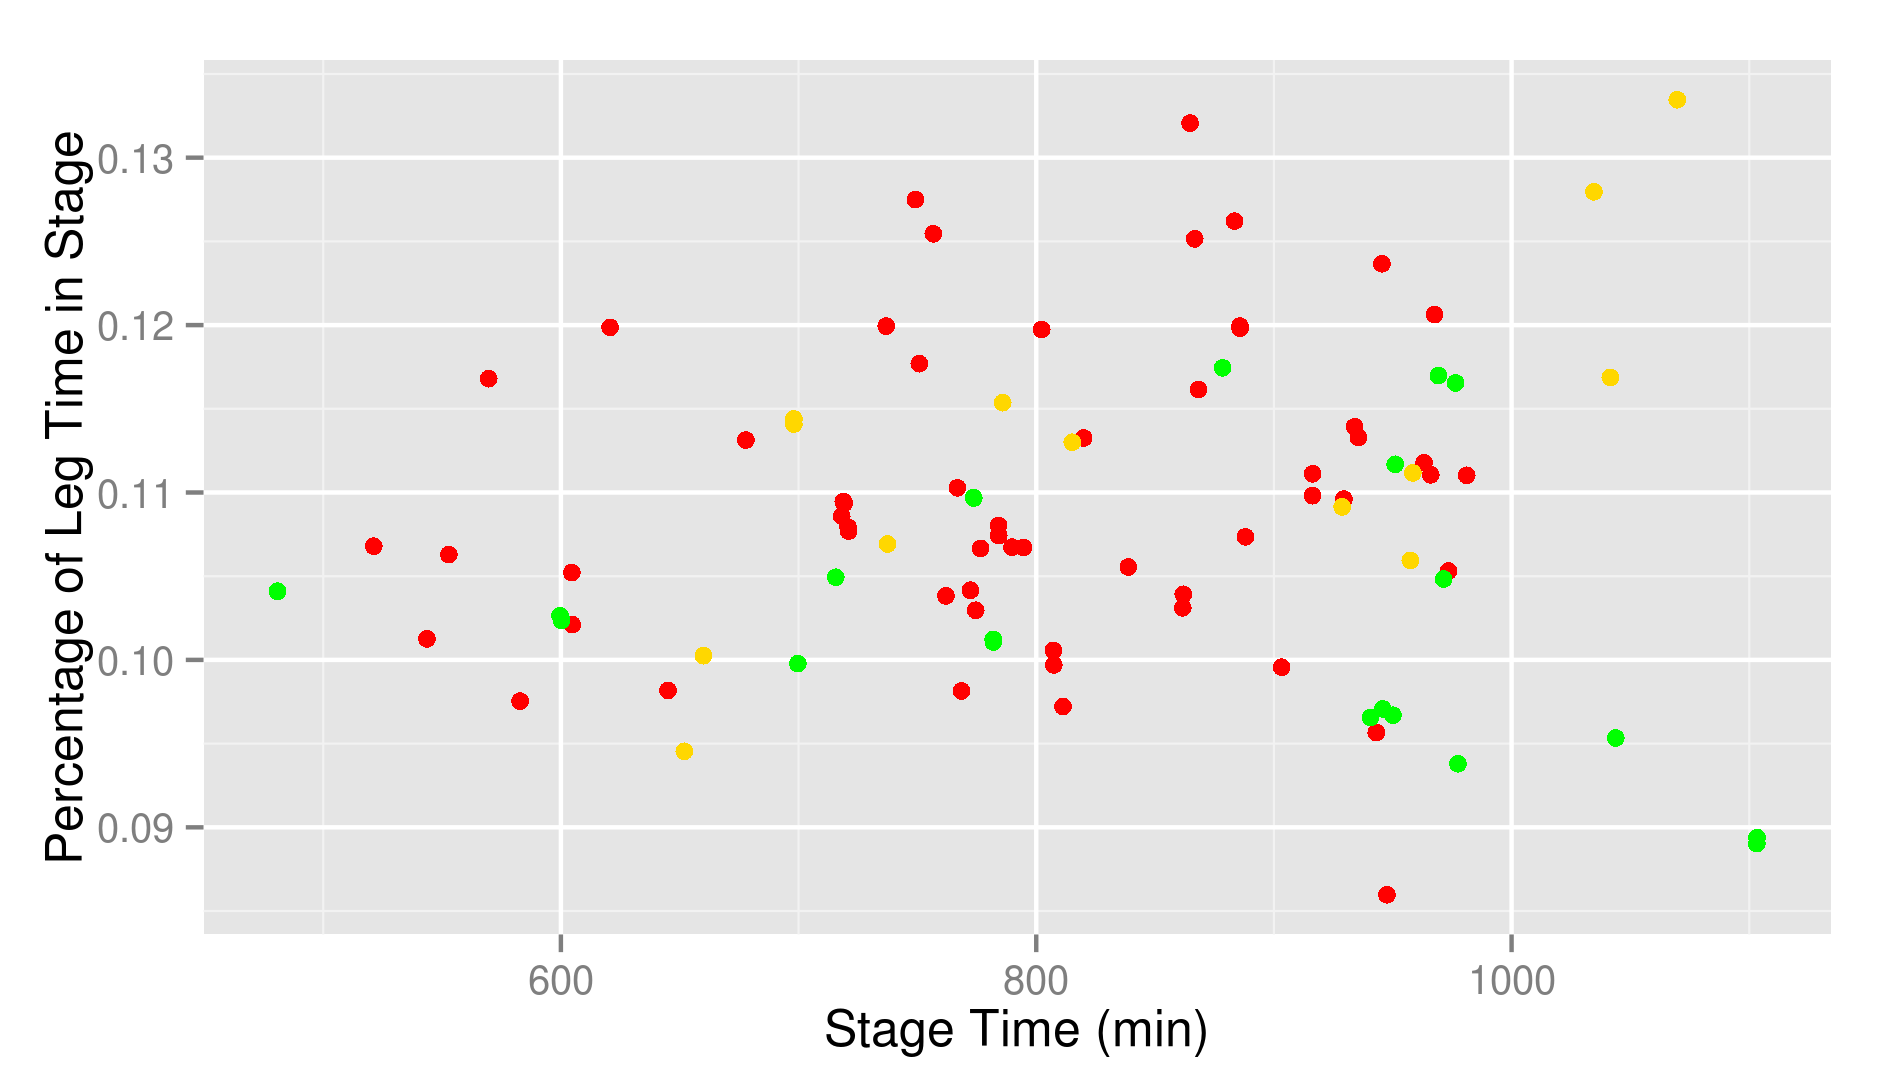
Below are the histograms of the percentage spent over each leg.
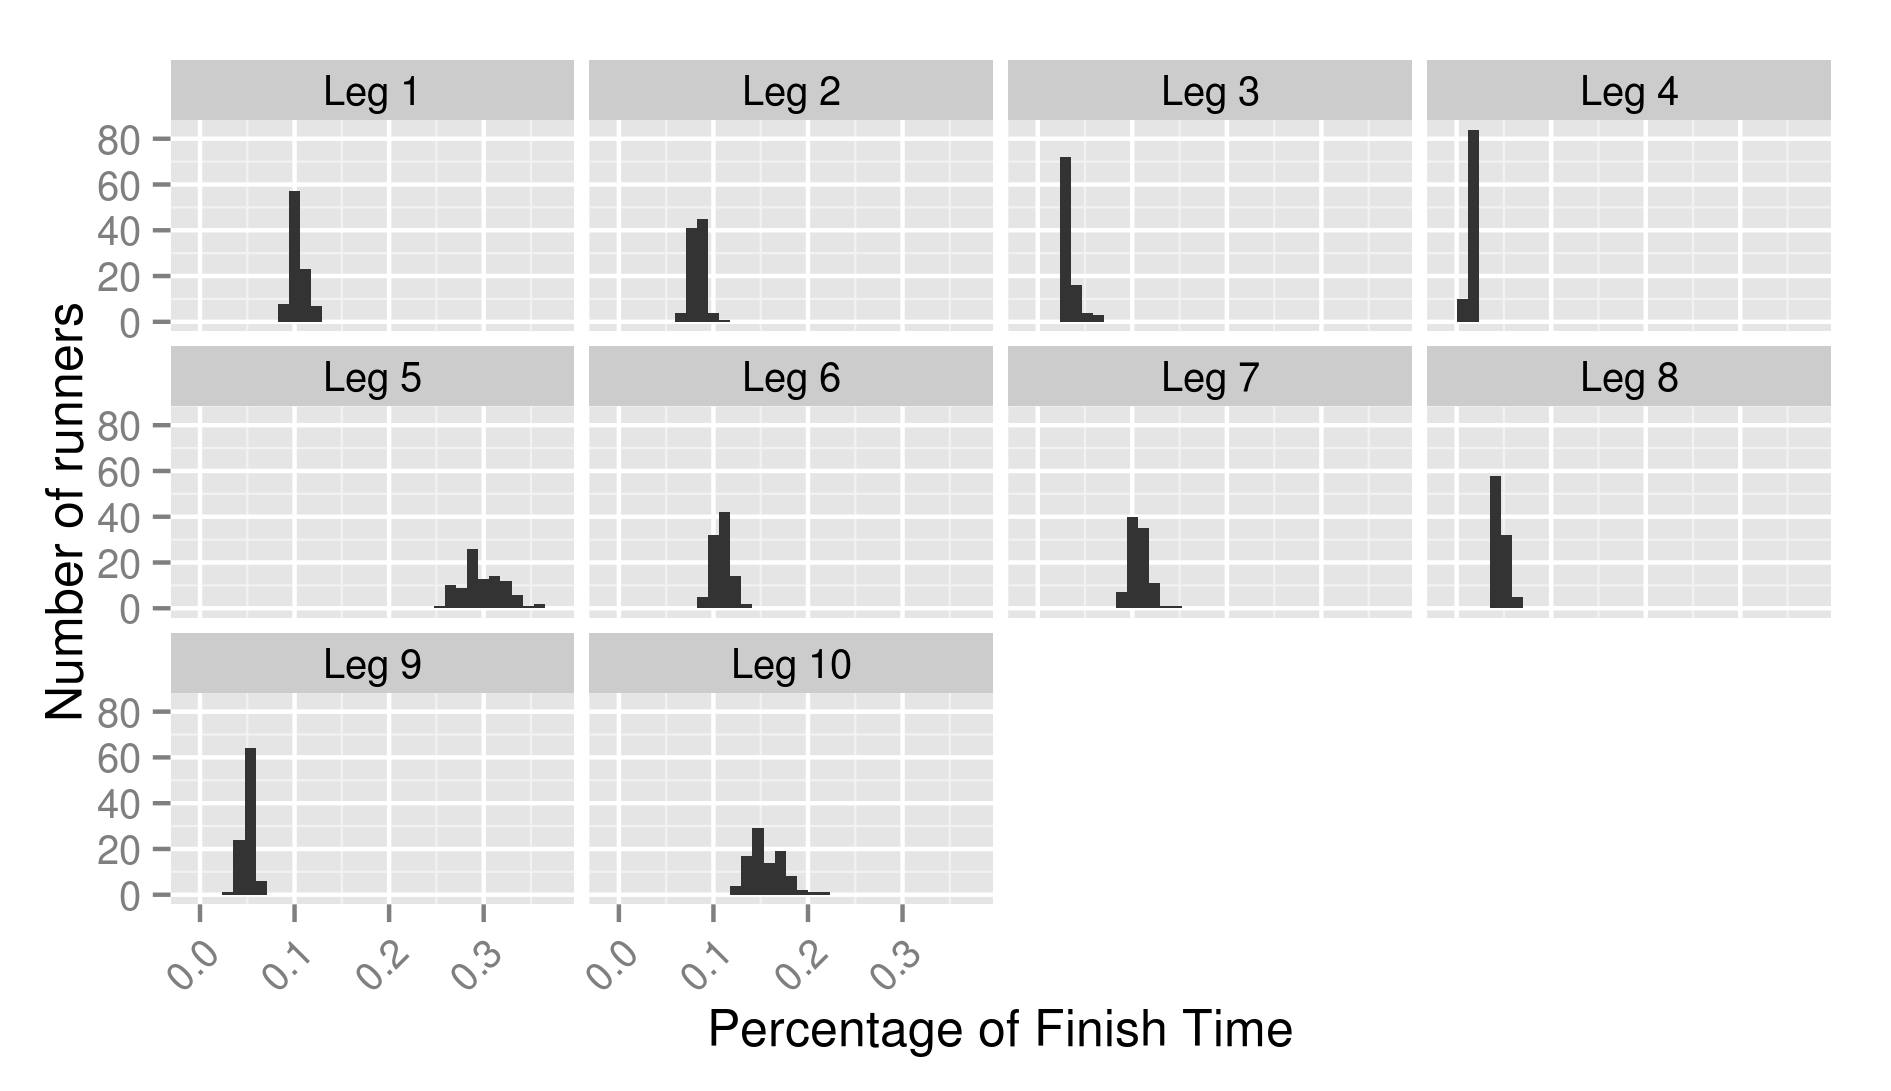
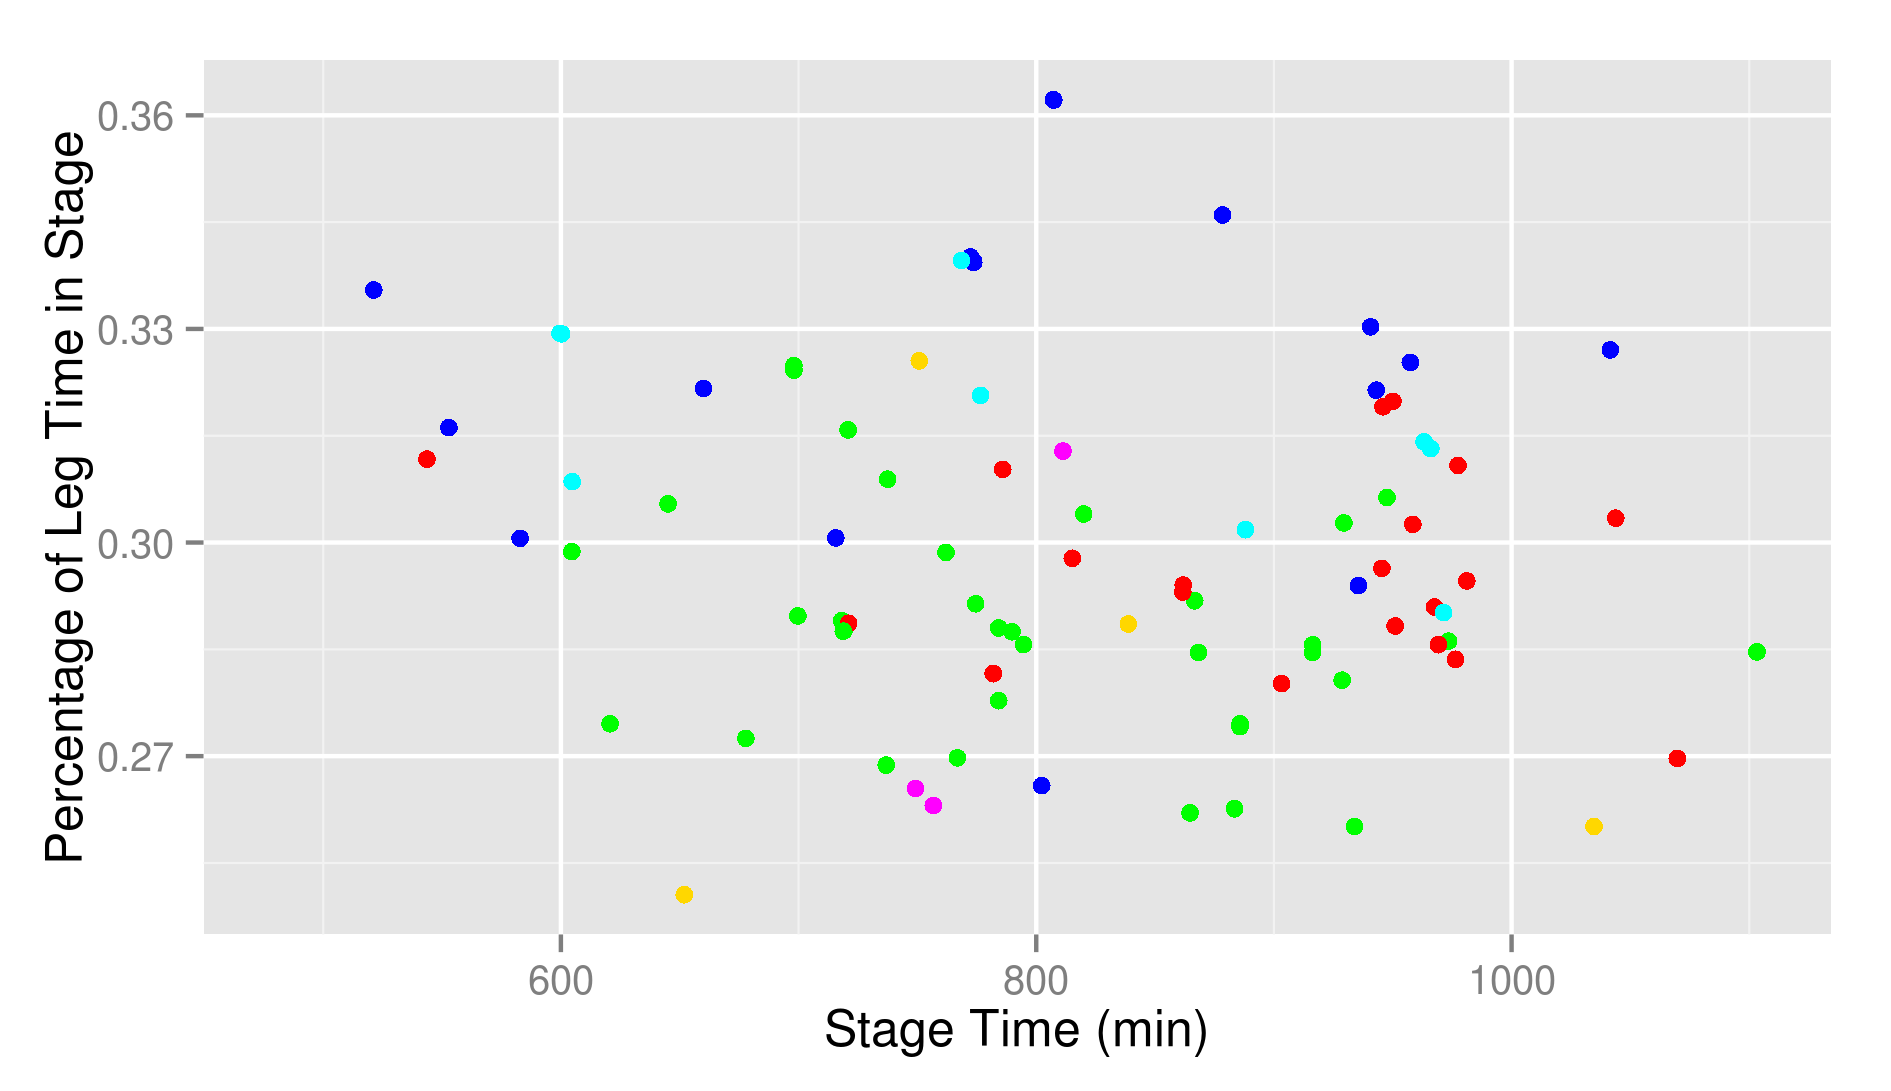
It is obvious that not all legs are created equal. Runners spend by far the longest on Leg 5. This leg takes about one third of the entire race. It also allows lots and lots of options, but we’ll get there later. My main assumption stays that percentage spent over each leg is constant over all runners. Let’s see how this assumption holds together in stage 2.
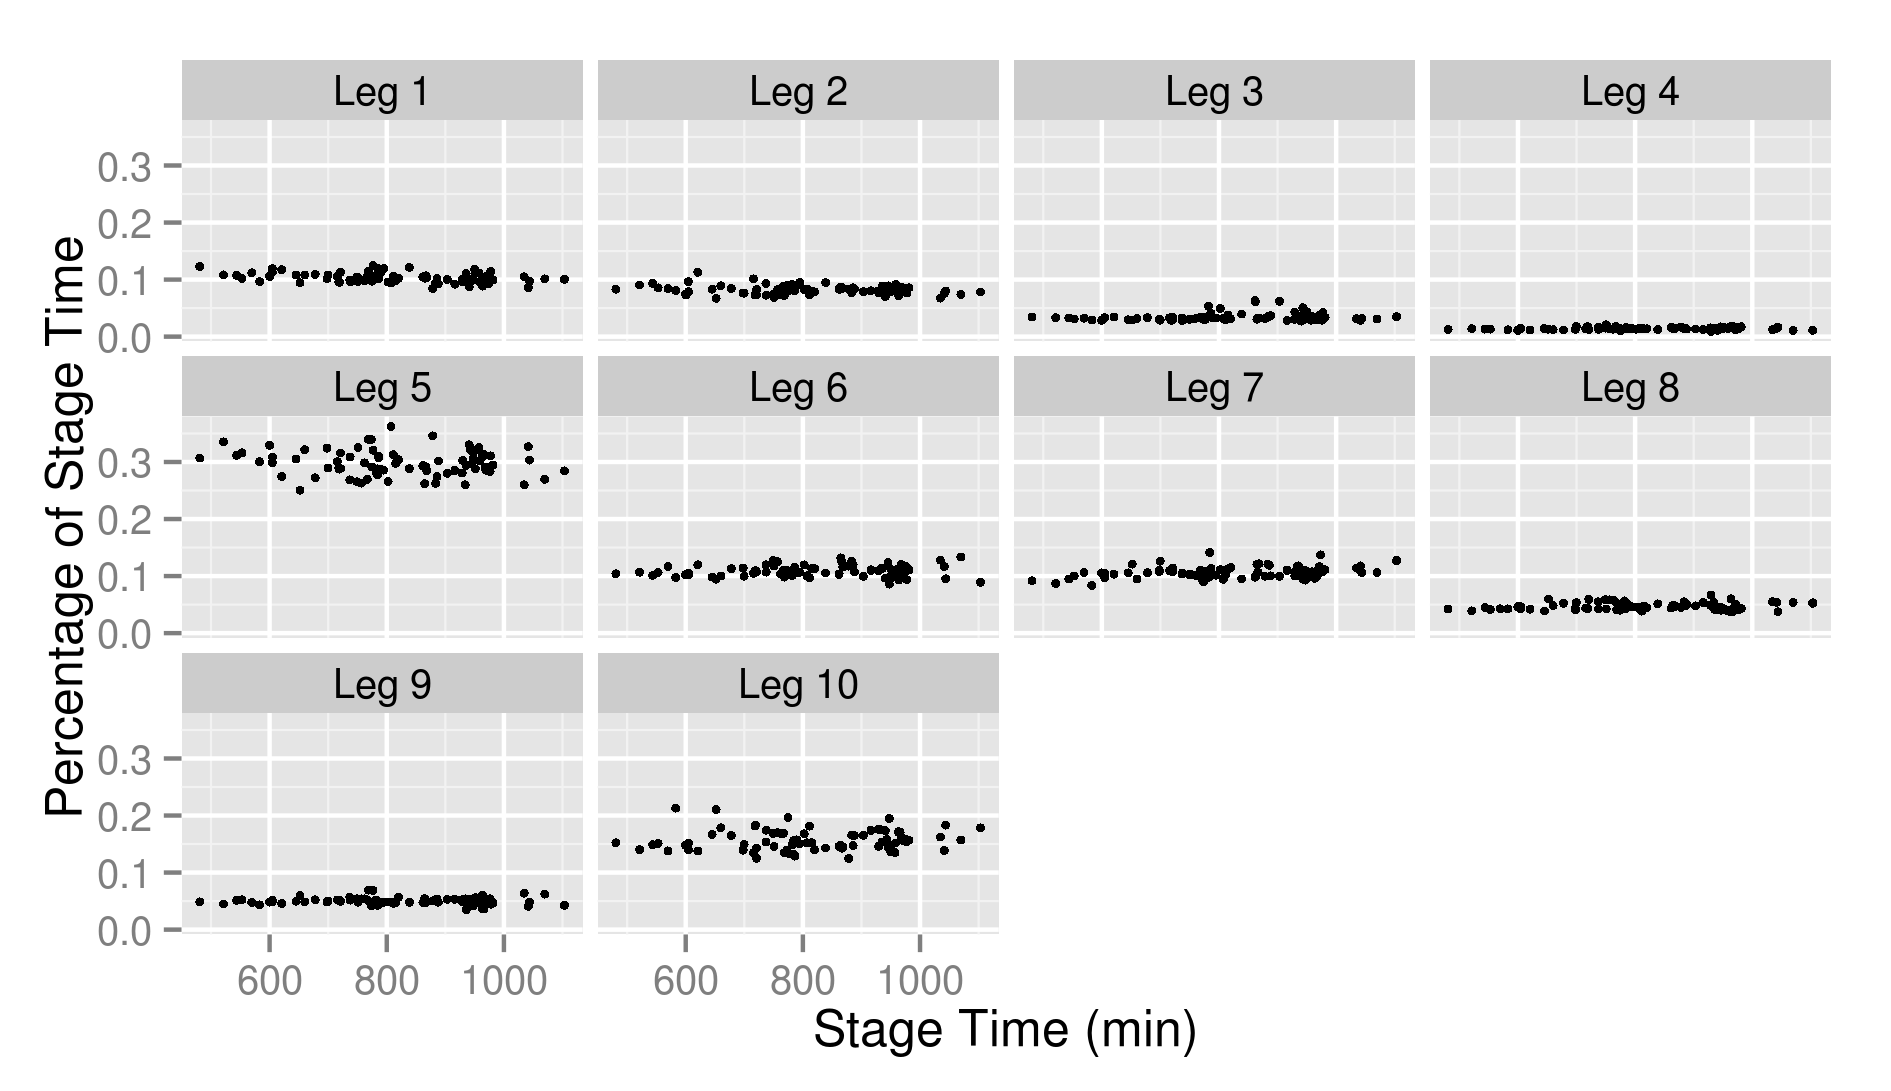
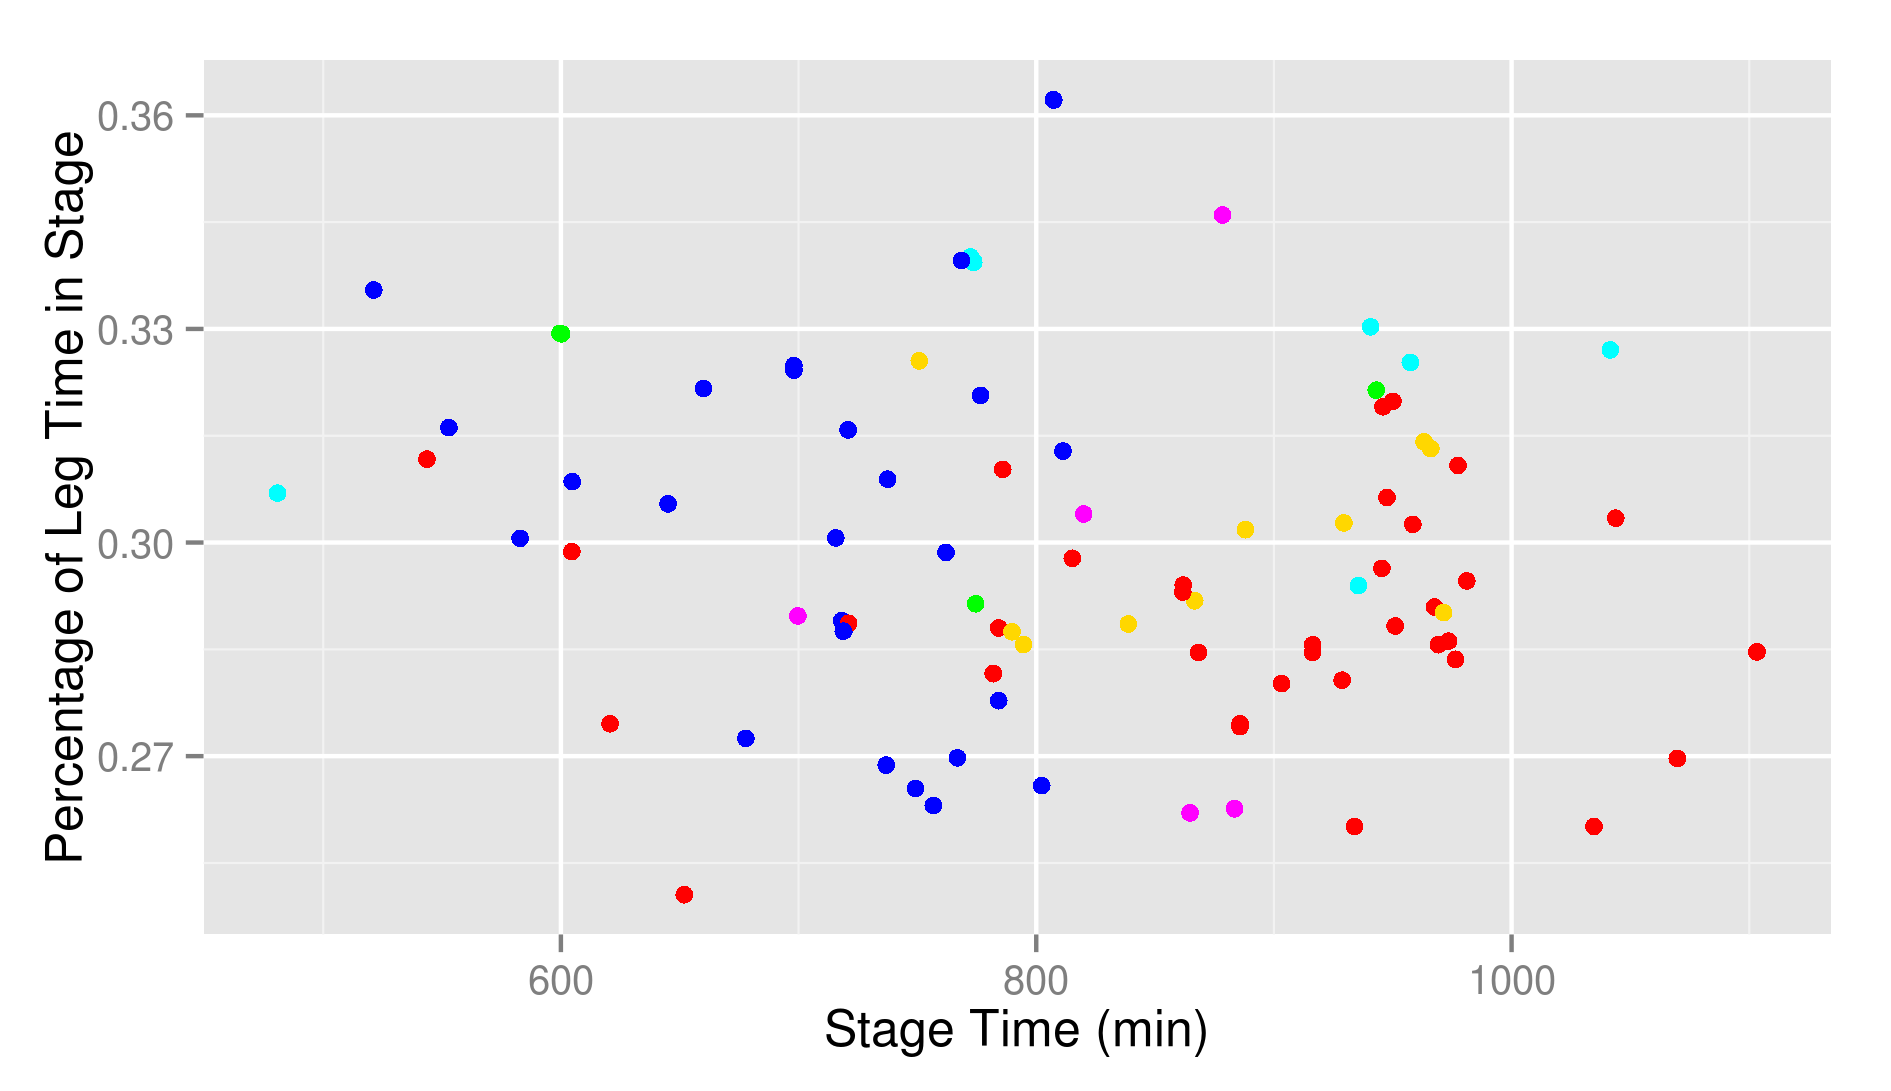
Not bad. Really not bad. I looks even better than in stage 1. To be sure, I also calculated the slopes of the regression lines.
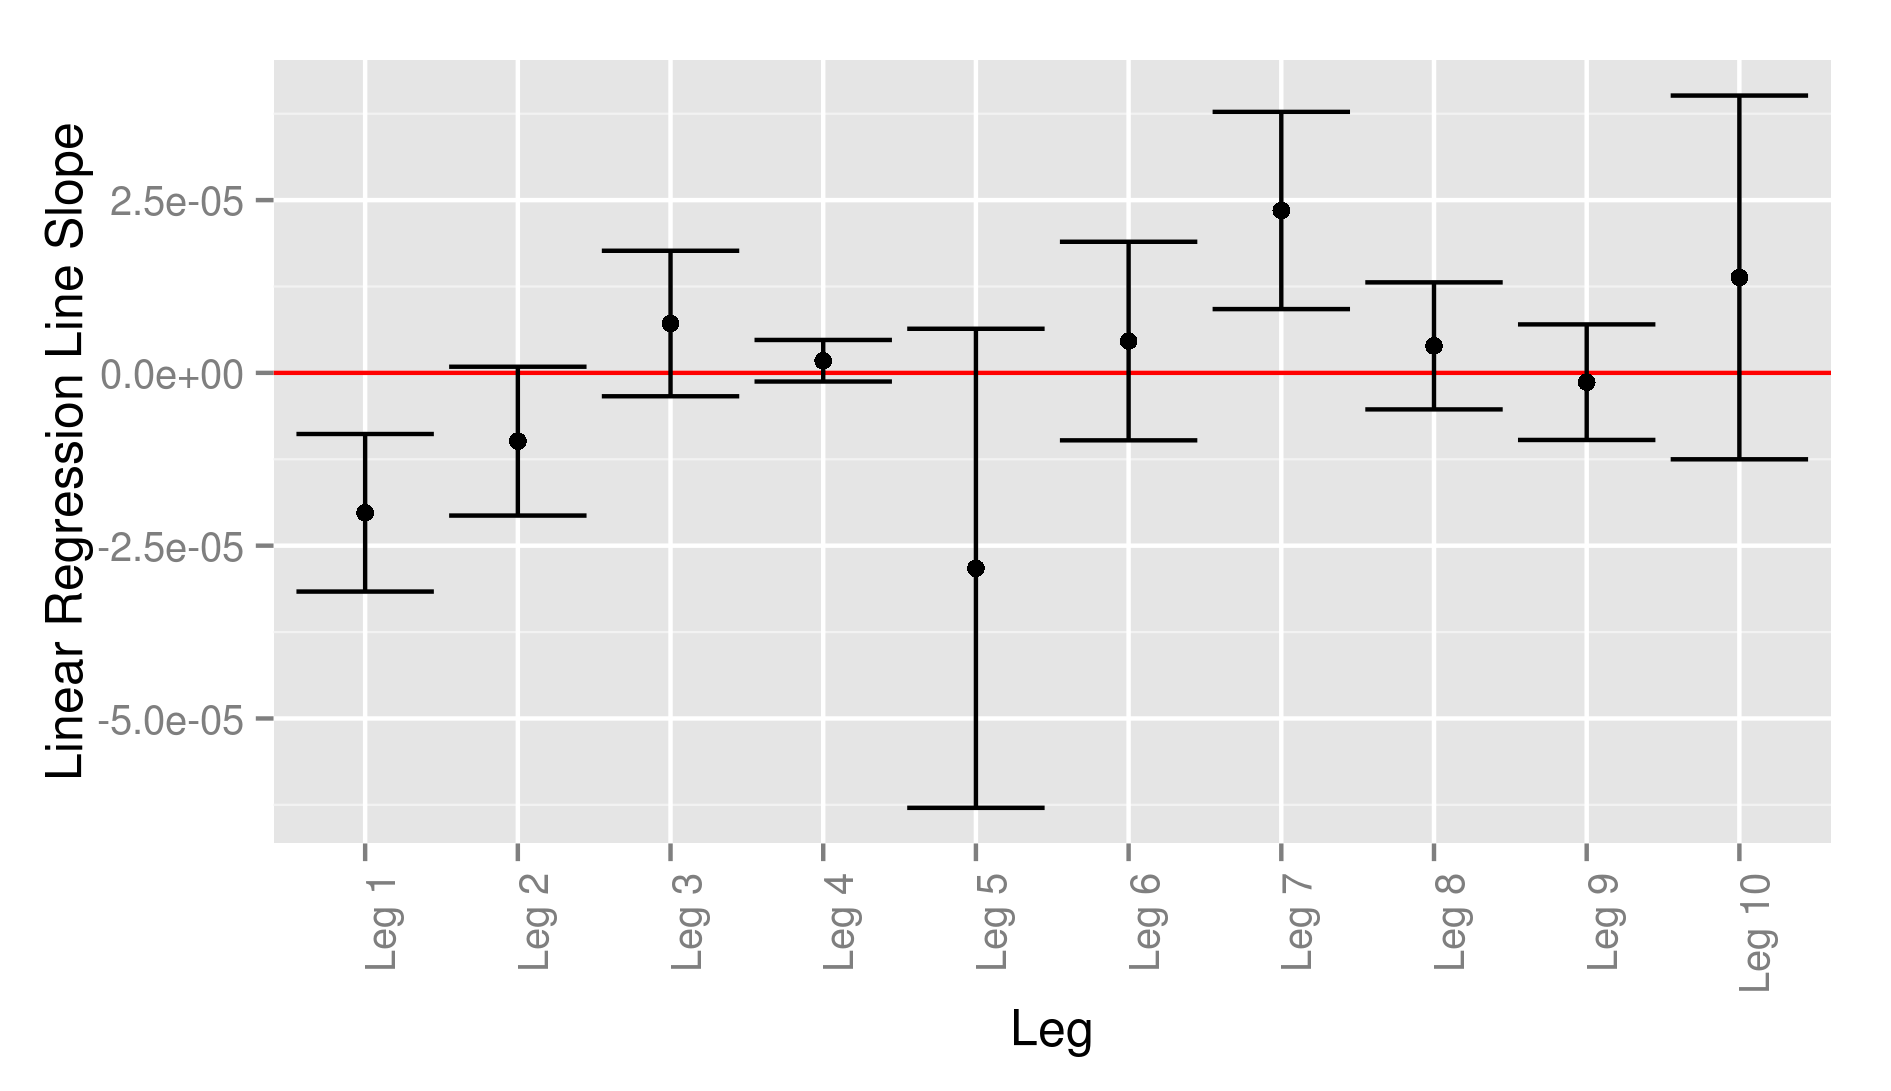
Just like during day 1, the faster runners took a somewhat easy start. But contrary to day 1, the plots flat-lines very early. From the second leg on, you don’t see anything that clearly deviates from a flat line. The only exception is Leg 7 that appears to compensate a bit for Leg 1.
Just as for stage 1, I made a set of boxplots. This is mine.
You see clearly where I had bad patches and made stupid mistakes. Again, they are for all runners available in a zip file.
Leg 1
The fastest time was run by Damian Hall with 56.3 minutes.
The median time was 82.9 minutes.
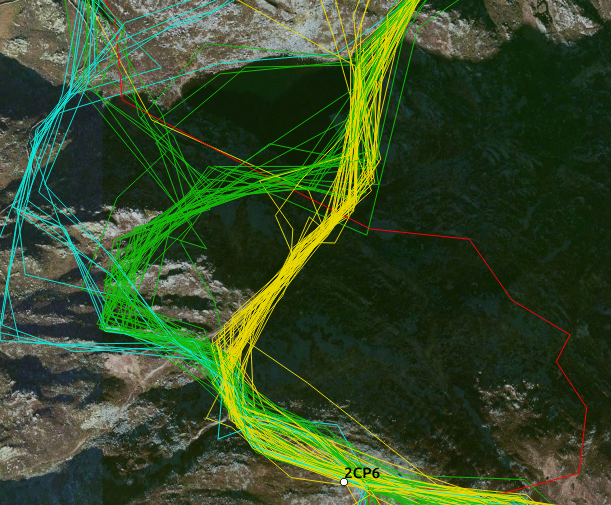
This is the climb up Cnicht.
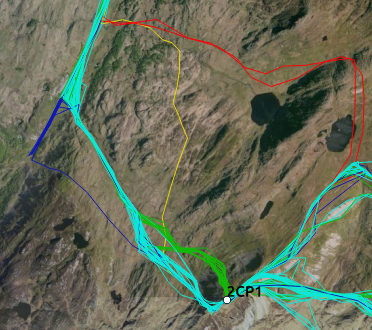
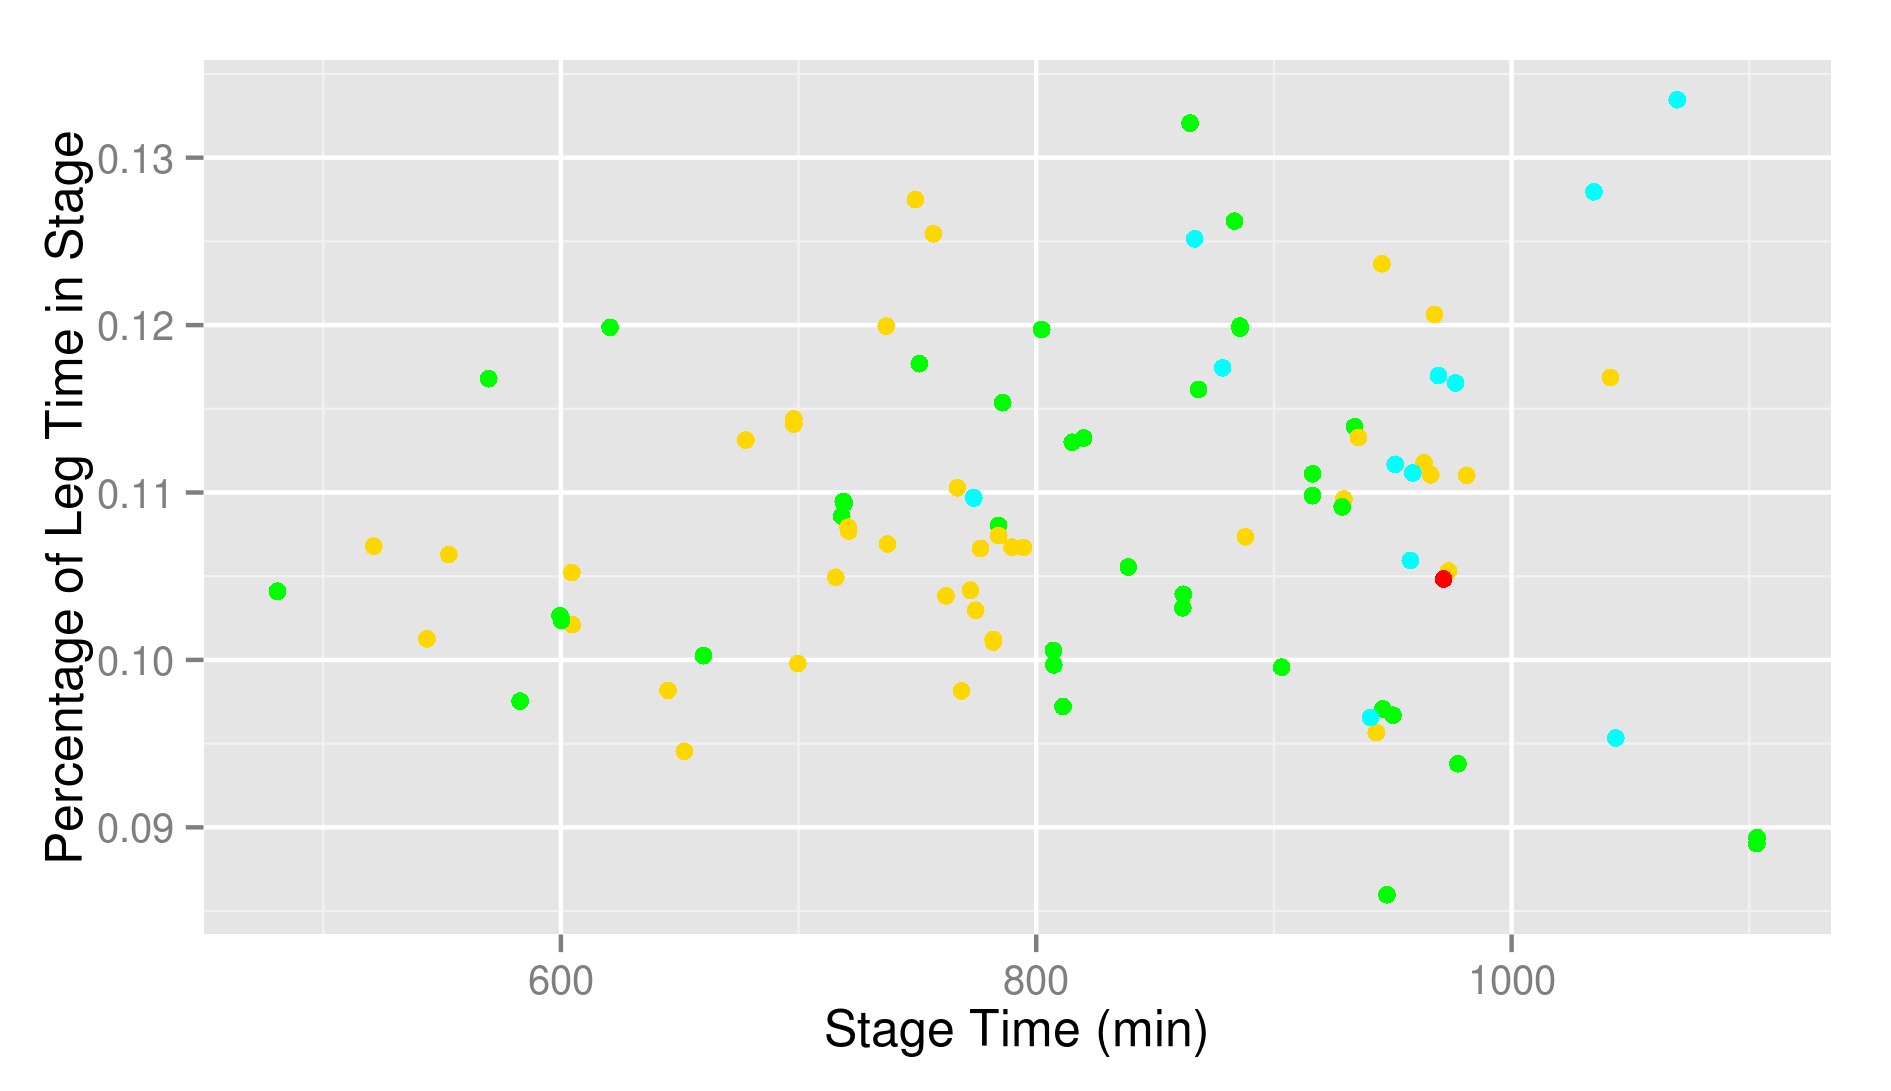
There is a very logical option, but it has some variation. Basically, you run towards a shoulder to the east of the summit and at some point you turn towards the summit. The point where this turn is made and the line taken afterwards can vary somewhat. Most runners where on one of two more or less parallel lines. Those are shown in green (22 runners) and cyan (64 runners). Then, there are some less popular options. There were a few (6) runners, shown in blue, that did something that looks suspiciously like overshooting. But the real original ones turned earlier away from the path to approach Cnicht from another side. One runner (yellow) approached from the south, while two runners (red) make a big detour and approached the summit from the NE. This is what the usual scatterplot looks like:
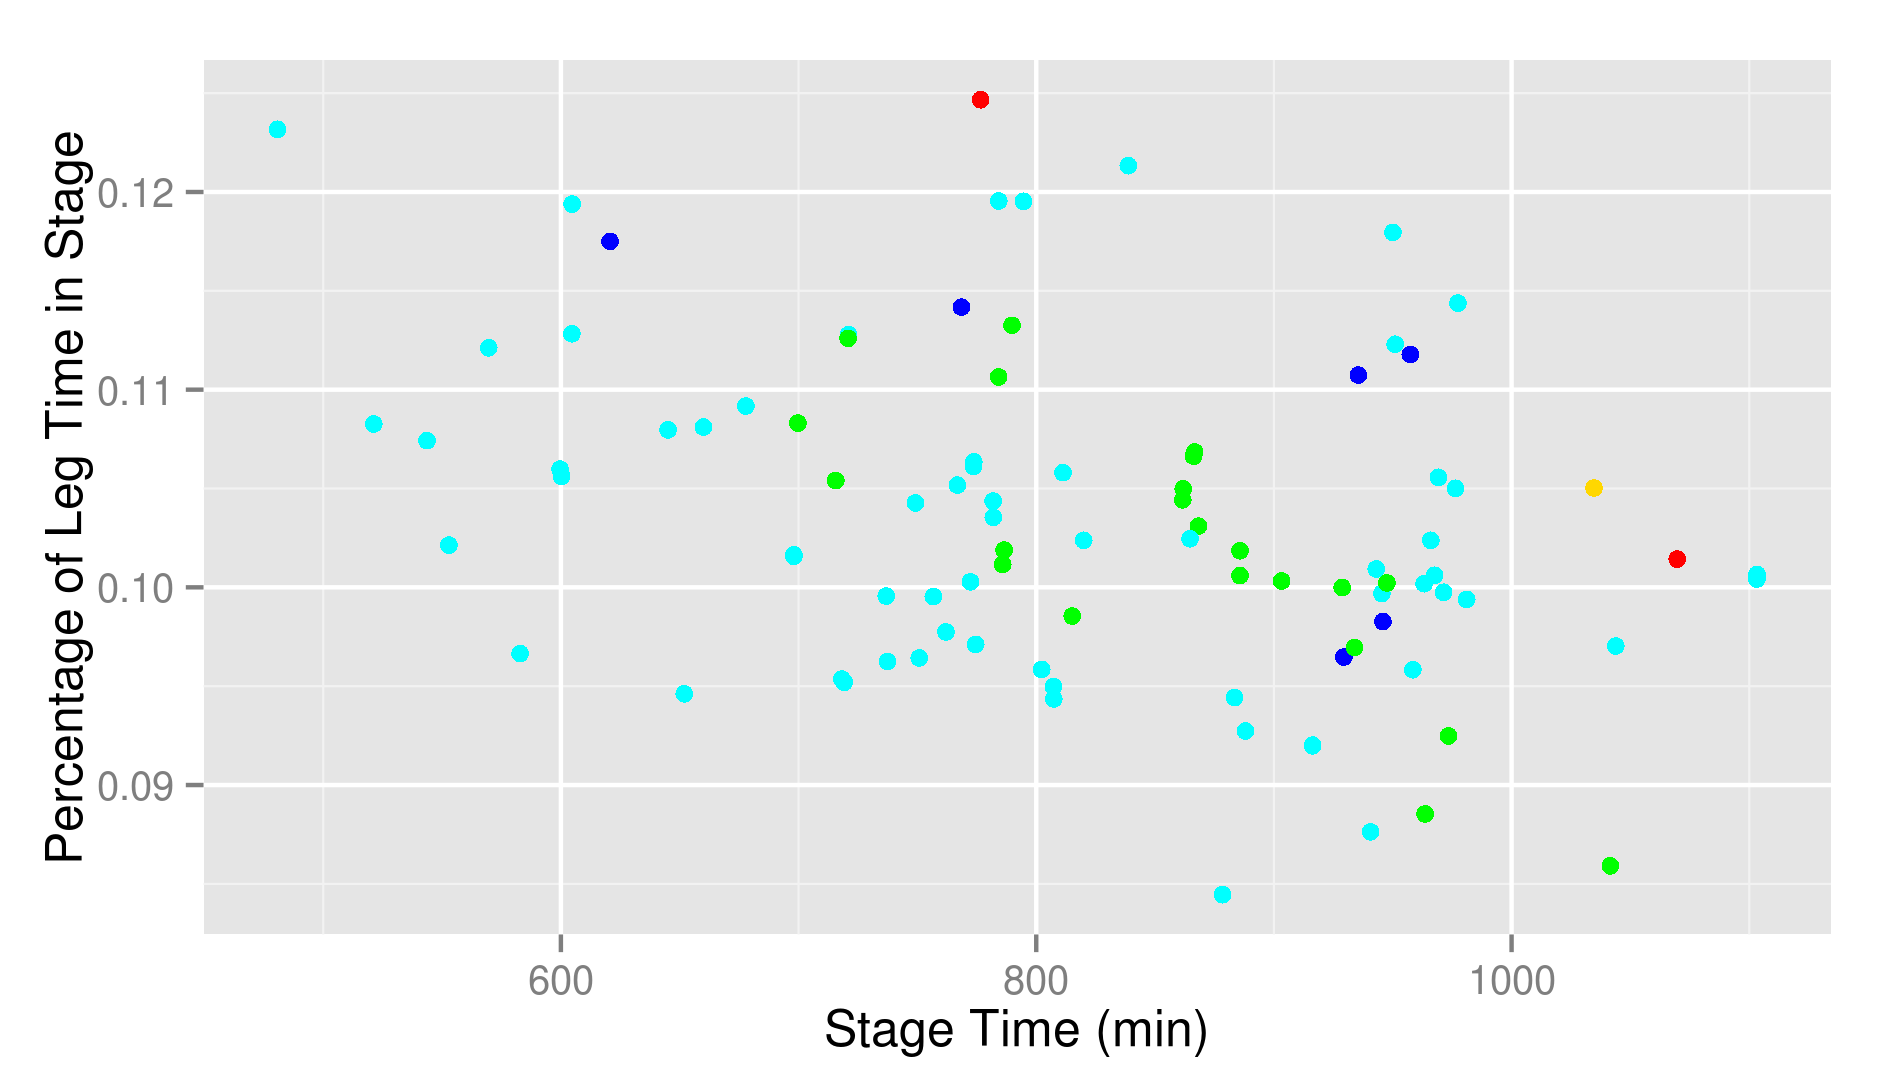
From the plot, no obvious winner emerges. Also a statistical test does not give a winner. I think it doesn’t really matter. Personally, I would avoid the red and yellow options. Both don’t look very promising to me, and probably with more data we would be able to see a difference. You obviously should avoid backtracking, but between green and cyan… No, really doesn’t change a thing.
Leg 2
The fastest time was run by Jim Mann with 40.0 minutes.
The median time was 68.8 minutes.
Another leg with multiple very different options.
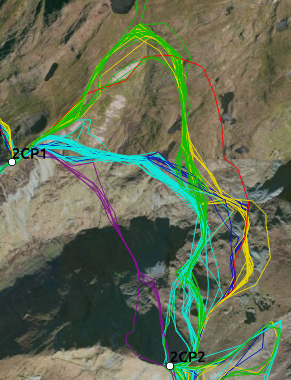
The most popular option is leaving the summit to the west and contouring around the edge of the valley. This is shown in cyan and was followed by 42 runners. Another very popular option (29 runners) is starting towards the NE and then turning south to the end of the valley. This is the green line. At first, this looks like a very long way. It is, but there is a rather obvious path that you follow (I ended up on it in 2013). Both of those have a variant where the runners took a wider turn around the valley. For cyan this variant is shown in blue (7 runners) en for green in yellow (14 runners). I found it remarkable that after joining, blue and yellow split and join again, where the choice at that point simply depends on how they left the checkpoint. Finally, a few runners (five) went across the valley. Obviously the shortest way, but it involves a lot more elevation change. What does the scatterplot tell us?
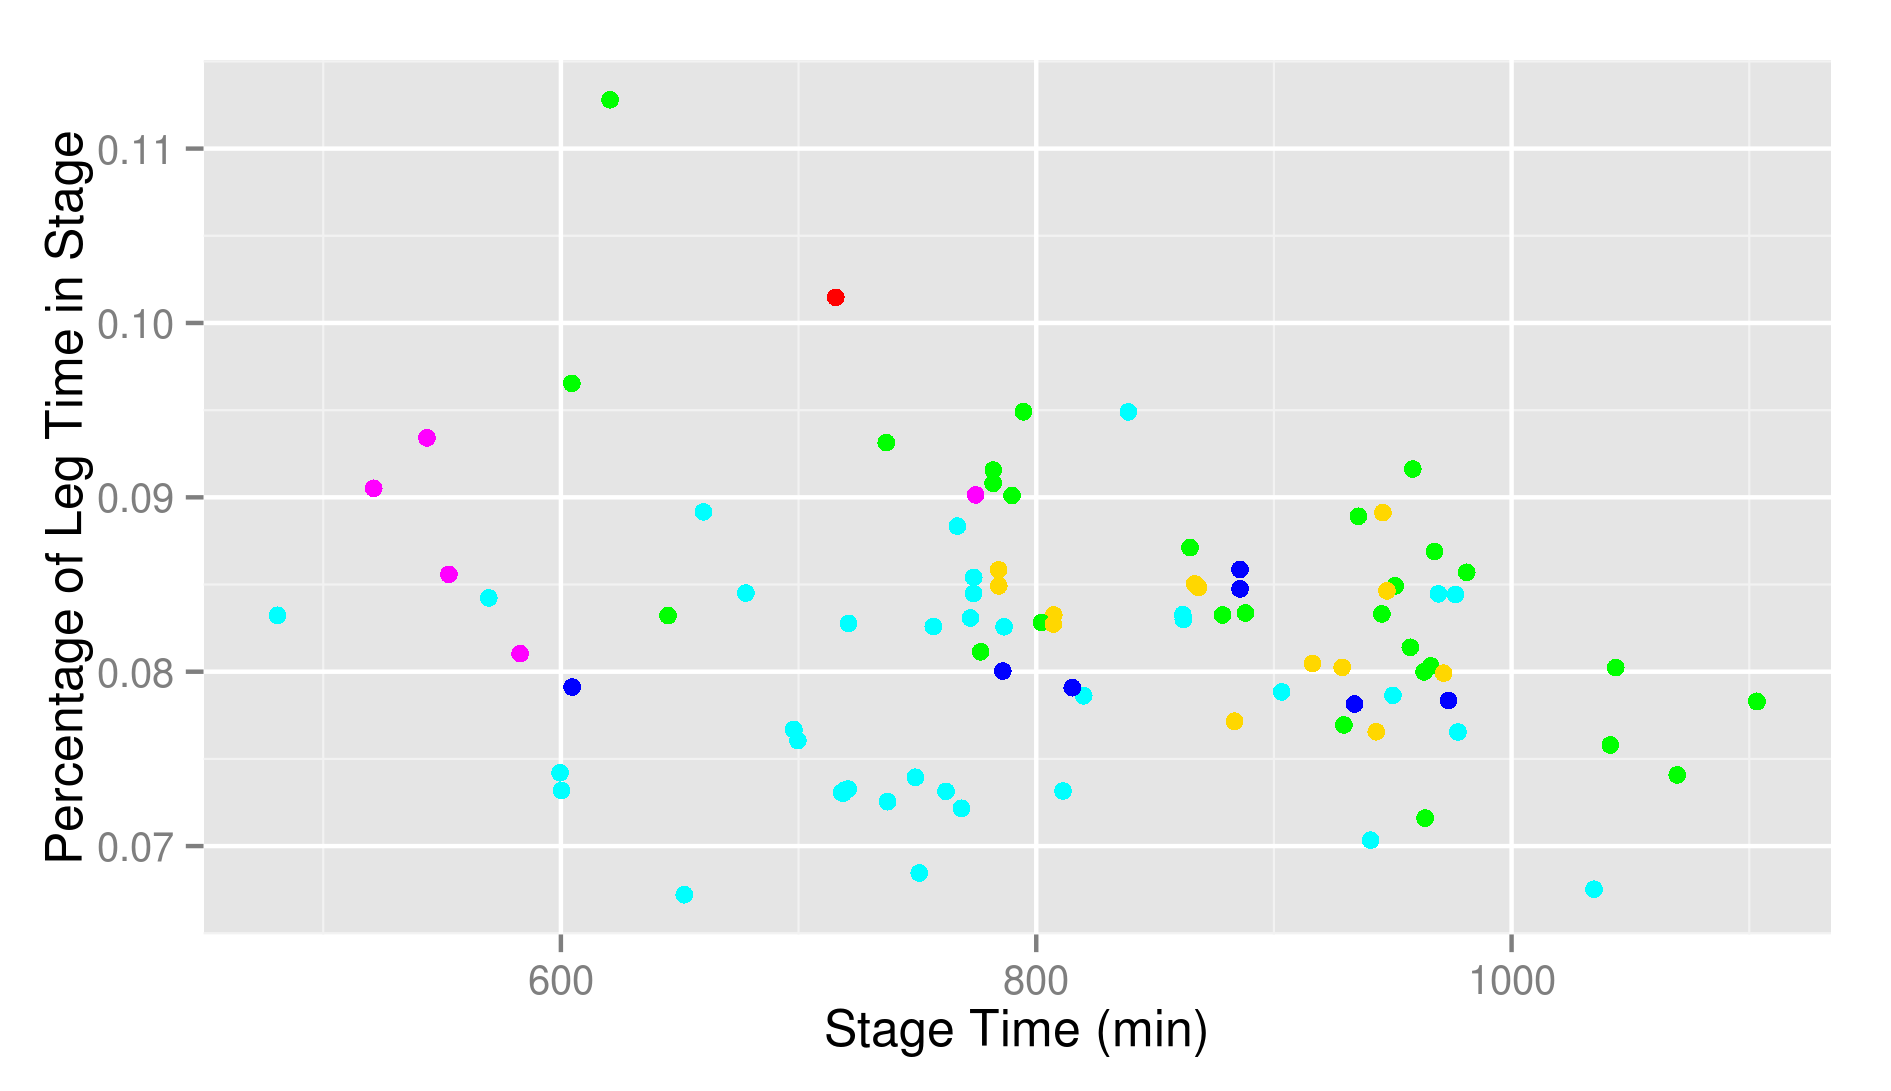
First of all, I am a bit surprised how fast green and yellow are. They look like enormous detours, but are in fact rather competitive options. Simply from the plot I would say that cyan looks the most promising. But all options give a surprisingly similar result. If we just calculate the averages, the order is cyan (7.8%), blue (8.1%), yellow (8.3%), green (8.5%), magenta (8.8%) and red (10.1%). If you like p-values, I can only give you a significant difference between cyan and both green and magenta. Otherwise, you’d have to ignore multiple testing corrections to have significance, but that really feels like cheating. My conclusion would be to start from Cnicht towards the east. If you don’t nail the contouring, it doesn’t really matter. If you find yourself on the path going north-east, don’t panic. It’s rather fast anyhow. But avoid going across the valley. It isn’t fast and it is hard work.
Leg 3
The fastest time was run by Jim Mann with 16.6 minutes.
The median time was 26.5 minutes.
This is just running the obvious path between both Moelwyns. No interesting route choices to discuss. That is what I thought at least.
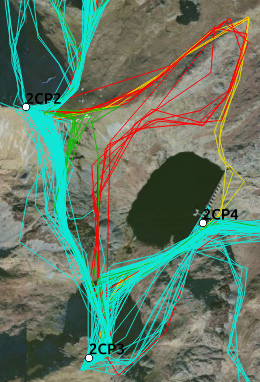
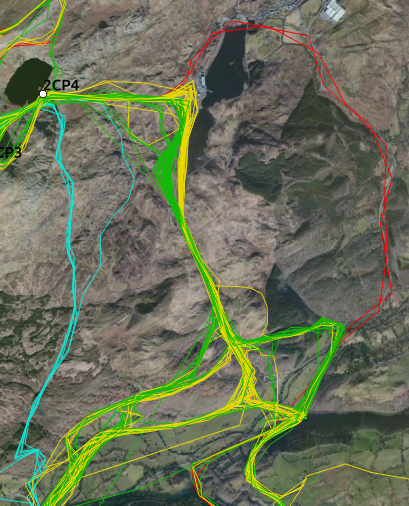
To be clear, we run from the dot labelled 2CP2 to the one with label 2CP3. The other one is CP4, where we go afterwards. Some runners thought the straight line sounds too good to be true. The straight line is in cyan and was followed by 73 runners. Other options involve starting towards the east and turning south at some point. The green ones (10 runners) decided quickly that they were going east, while they wanted south and corrected quickly. Not so for the yellow (3 runners) and red (8 runners). They made a huge loop to the east, where the yellow ones even passed checkpoint 4 before heading up to CP3.
This looks rather clear. Anything that is not the straight line gets punished. So, when you are standing on the first Moelwyn, take a look at your compass and make sure that you go in the right direction.
Leg 4
The fastest time was run by Jim Mann with 6.1 minutes.
The median time was 12.0 minutes.
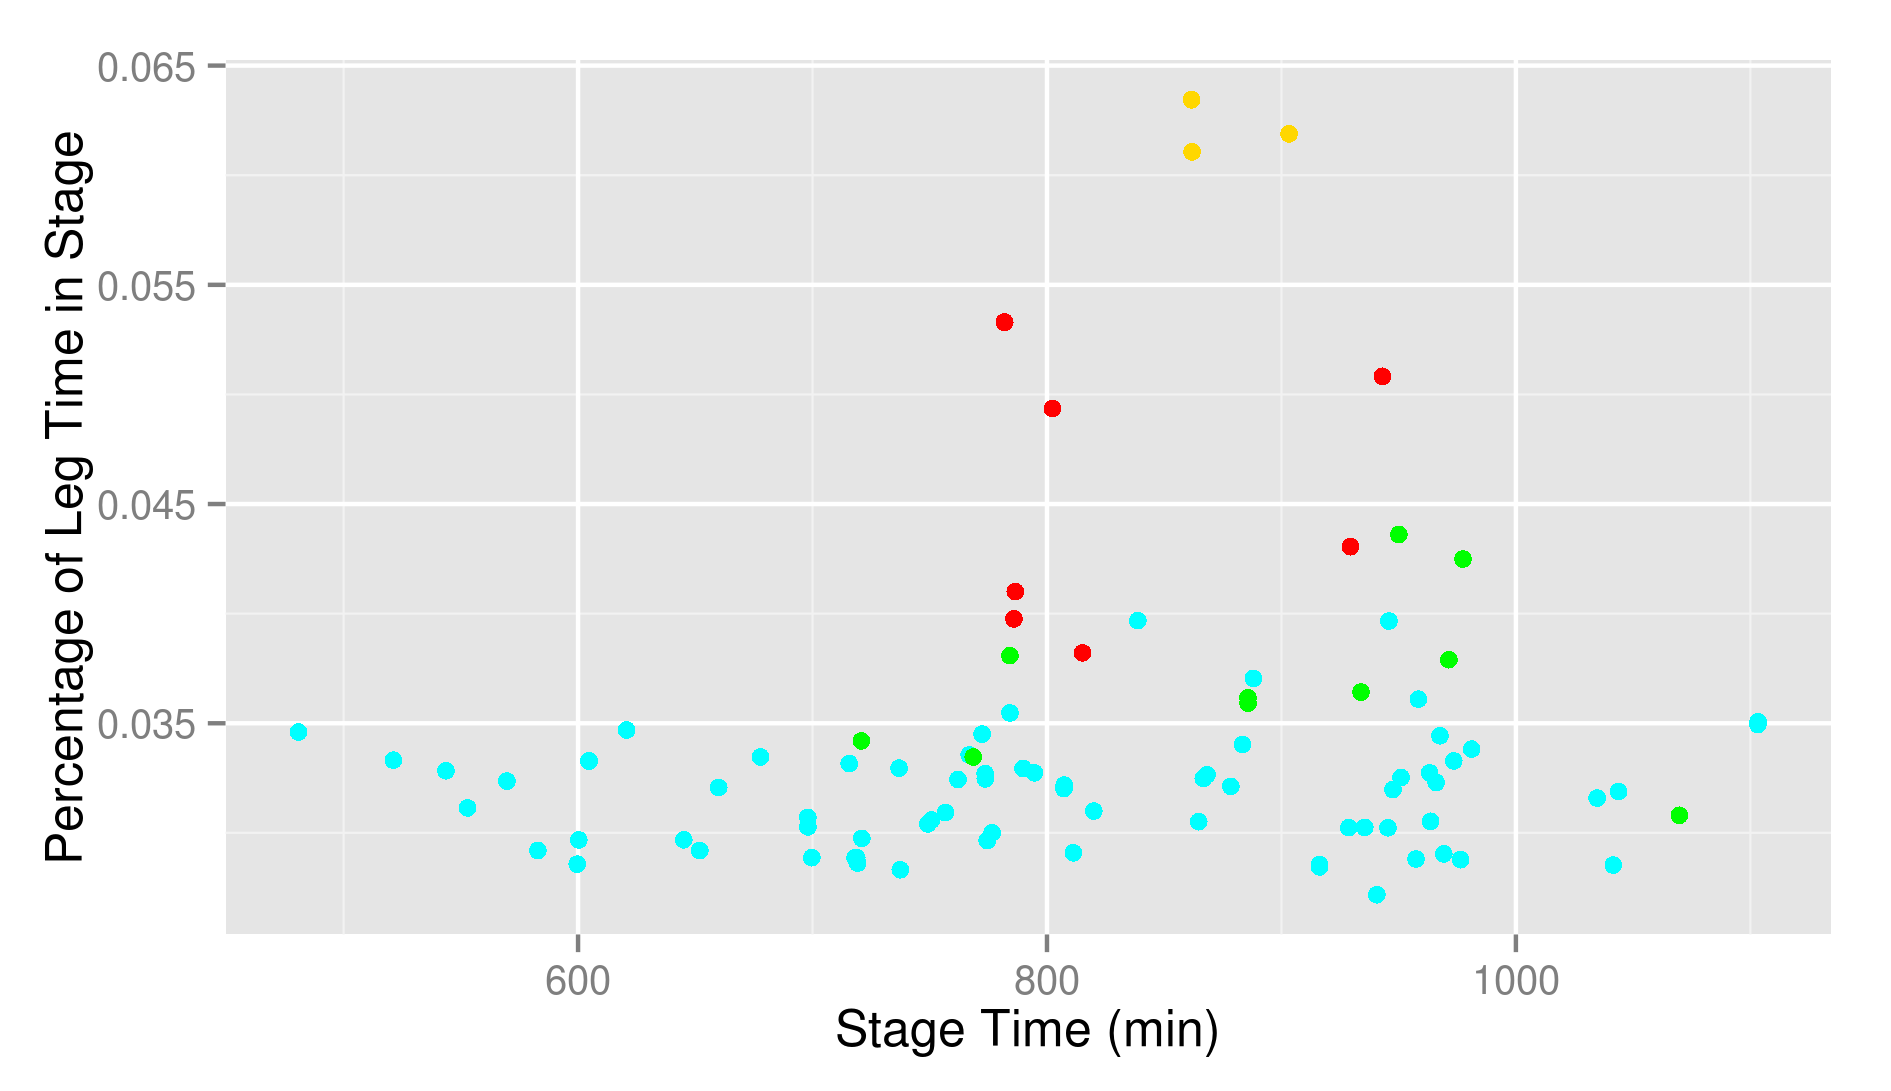
This is another very short leg, but two options are visible.
The first option is to backtrack along the path towards the saddle and turn right towards the reservoir. Those are shown in yellow (34 runners) and green (49 runners). The distinction is that the yellow ones turned a bit earlier. Keep in mind that here the distinction could on occasions be influenced by a limited number of track points. The second (red, 10 runners) option is starting to the east and following a rather straight line ignoring the main path.

The red line is the fastest option and you can get a decent p-value if you would like to. The caveat is that the runners that took the shortcut are clearly the faster runners, so I lean heavily on the assumption that the percentage should be independent of running speed. In any case, my conclusion is that you shouldn’t stick to the path for too long, but aim for a direct line.
Leg 5
The fastest time was run by Jim Mann with 147.6 minutes. It is worth noting that Jim was here more than 15 minutes faster than anyone else.
The median time was 243.9 minutes.
This leg is one of the big mysteries of the Dragon’s Back Race. It is very long and offers a huge amount of options. Some are fast and long, others are shorter but slower. Nobody really knows what gets you the quickest to the support point. When looking at the tracks, a huge number of options is visible. I tried to get some structure in them. To do that, I separately look at different parts of the stage. Let’s start with how one gets down from the Moelwyns.
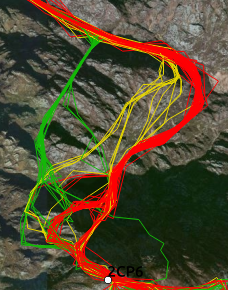
Most runners took the logical option of descending to the railway tracks and followed the valley to the south. To distinct options are visible: all the way at the bottom (yellow, 44 runners) or on the path a bit higher on the slope (green, 43 runners). A few took a really distinct option. Two runners in red went to the north to Tan-y-grisiau and started some road running. Finally, three runners took a straight line south instead of dropping into the valley (cyan).

First surprise, the red option is really quick. It is certainly longer, but the running must be very easy. The cyan line also looks promising. I’d love to see some more data on that option. As for the difference between green and yellow, the average over yellow is 29.4% against 30.7%. Testing significance gives a p-value of 0.012. It looks like yellow is effectively faster than green.
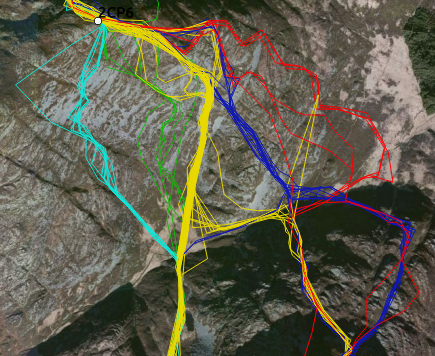
The following part of this stage that I will consider is how the runners entered and crossed the valley of the Afon Dwyryd.
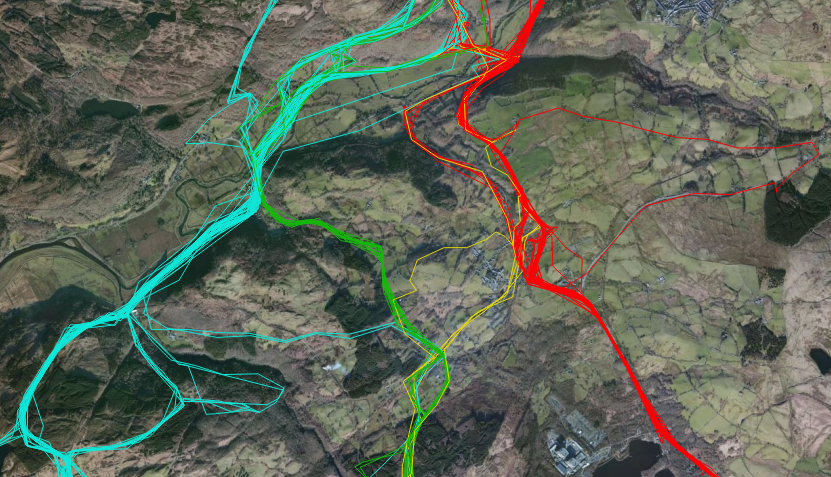
We see many distinct options. First of all, there are those that went straight south from CP4. Those are now shown in magenta (they were cyan on the previous map). Then, we take a look how the big pack splits up. There are those that went to the east to cross the rivers using some bridges that are there (red, 21 runners). Most went rather straight south. The obvious line is green (36 runners), while a few strayed to the east (yellow, 10 runners). Finally, there are those who stayed closer to the railroad. Of those the blue ones (17 runners) took a bit of a shortcut, while the cyan runners (10) went around, closely following the railroad.
Well, this is a bit of a mixed bag. Visually, I would say that green and red look better than blue and cyan. For yellow the picture is really mixed and magenta is still something that needs more data. Using Holm, you get p-values < 0.05 for cyan and blue versus all the others. Conclusion for me, you shouldn’t take those two. All the rest, I don’t really know.
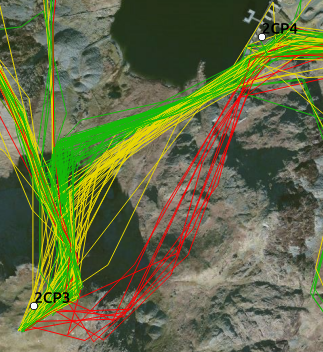
Then we have the big question. How do you cross the big emptiness that follows?
A popular option is to run all the way around the reservoir (red, 37 runners). That is quick running but a long way around. Others started similar, but crossed over to the dam (yellow, 5 runners). Then, we have those that went to Maentwrog, where the pack splits. Some (12 runners) took the green line to the SE, while most (37 runners) took the cyan line to the SW.
This really doesn’t say a thing. It is not with this choice that you will make the difference.
Now that we know how we start the big empty part, let’s try to classify the myriad of options.
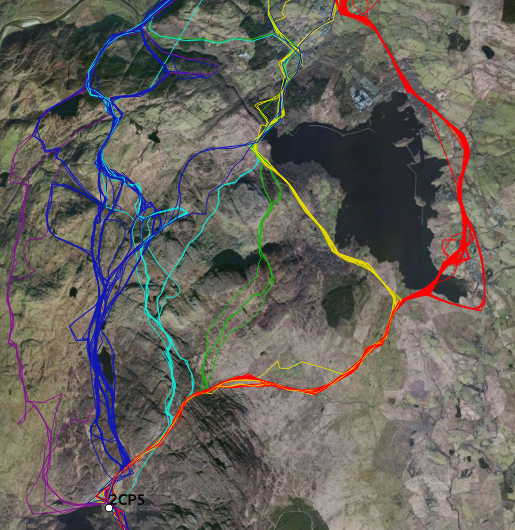
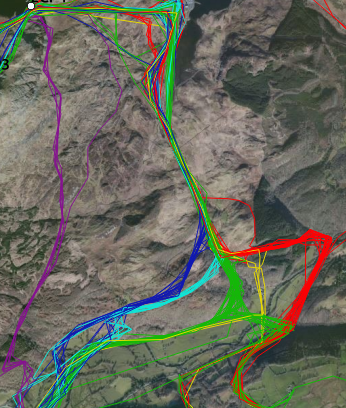
We recognise again the tour around the reservoir (red, 37 runners). Then, we have those that took the other side of the reservoir. This implies crossing the dam and following the wide path following the reservoir (yellow, 10 runners). The green line are runners that went to the dam and crossed towards Moel y Gyrafolen (green, 4 runners). The cyan lines are runners that went straight to the saddle (8 runners). Further to the west we have the blue lines with runners that went to Llyn Eiddew Mawr (28 runners), while even further to the west we have a purple line (5 runners).
Well, there is no magic bullet. Red and yellow are fast and low-risk options. If you don’t mind road running or are bad at navigating that is probably what you should do. For the others it is less clear. Green? Doesn’t look that promising… Cyan? More or less the same. Blue? Huge variability. It can be very good or very bad. Probably worth a try if you are confident in your navigation. Magenta? A bit mixed. It can be very good. Certainly an option to keep in mind. What is the best option? Really, I still don’t have the answer.
Leg 6
The fastest time was run by Jim Mann with 50.1 minutes. He gained again five minutes on anyone else.
The median time was 89.8 minutes.
The time in the leg will include the time spent in the halfway point. Keep this in mind when looking at the results for this leg. The start is obvious. You follow the path to the Roman steps. More interesting is how runners approached Rhinog Fawr
Most runners took the path and turned SW when there was a path going that way (red, 58 runners). Some were less patient and turned a bit earlier (yellow, 13 runners). But the most interesting to me was the green line (21 runners) that is a rather straight line. I even never considered that one.
Interesting. All options appear possibly good, with maybe green being the best option. The averages for each are 11.0% (red), 11.3% (yellow) and 10.3% (green). If you want p-values you get 0.01 for green against the rest (using Holm adjustment). The next time, I think that I’ll give green a try.
Also in the last part to the summit there are different options.
The most popular is a rather straight line (yellow, 40 runners), closely followed by a loop to the west (green, 38 runners). Then, there is an even wider loop that was taken by 13 runners (cyan). Finally, one runner was original and approached the summit from the east instead of the west (red).
The conclusion is that is doesn’t matter a thing. Even the red option is perfectly fine.
Leg 7
The fastest time was run by Jim Mann with 44.2 minutes.
The median time was 85.4 minutes.
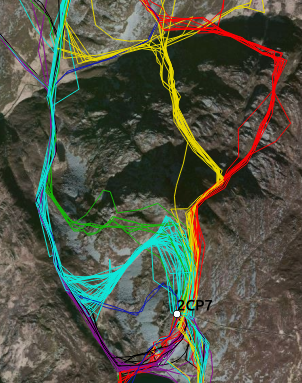
This is crossing from Rhinog Fawr to Rhinog Fach. This is another place where many options are possible. I’ll split it into two parts. Firstly, the options to descend Rhinog Fawr and secondly the options to climb Rhinog Fach.
To come down most (59) runners followed the yellow line. Where that line turns, some (12) went straight following the blue line. Others went even further east to find their way down (red, 6 runners). Looking to the west of the yellow line we see a green line with 6 runners and a cyan line with 9 runners.
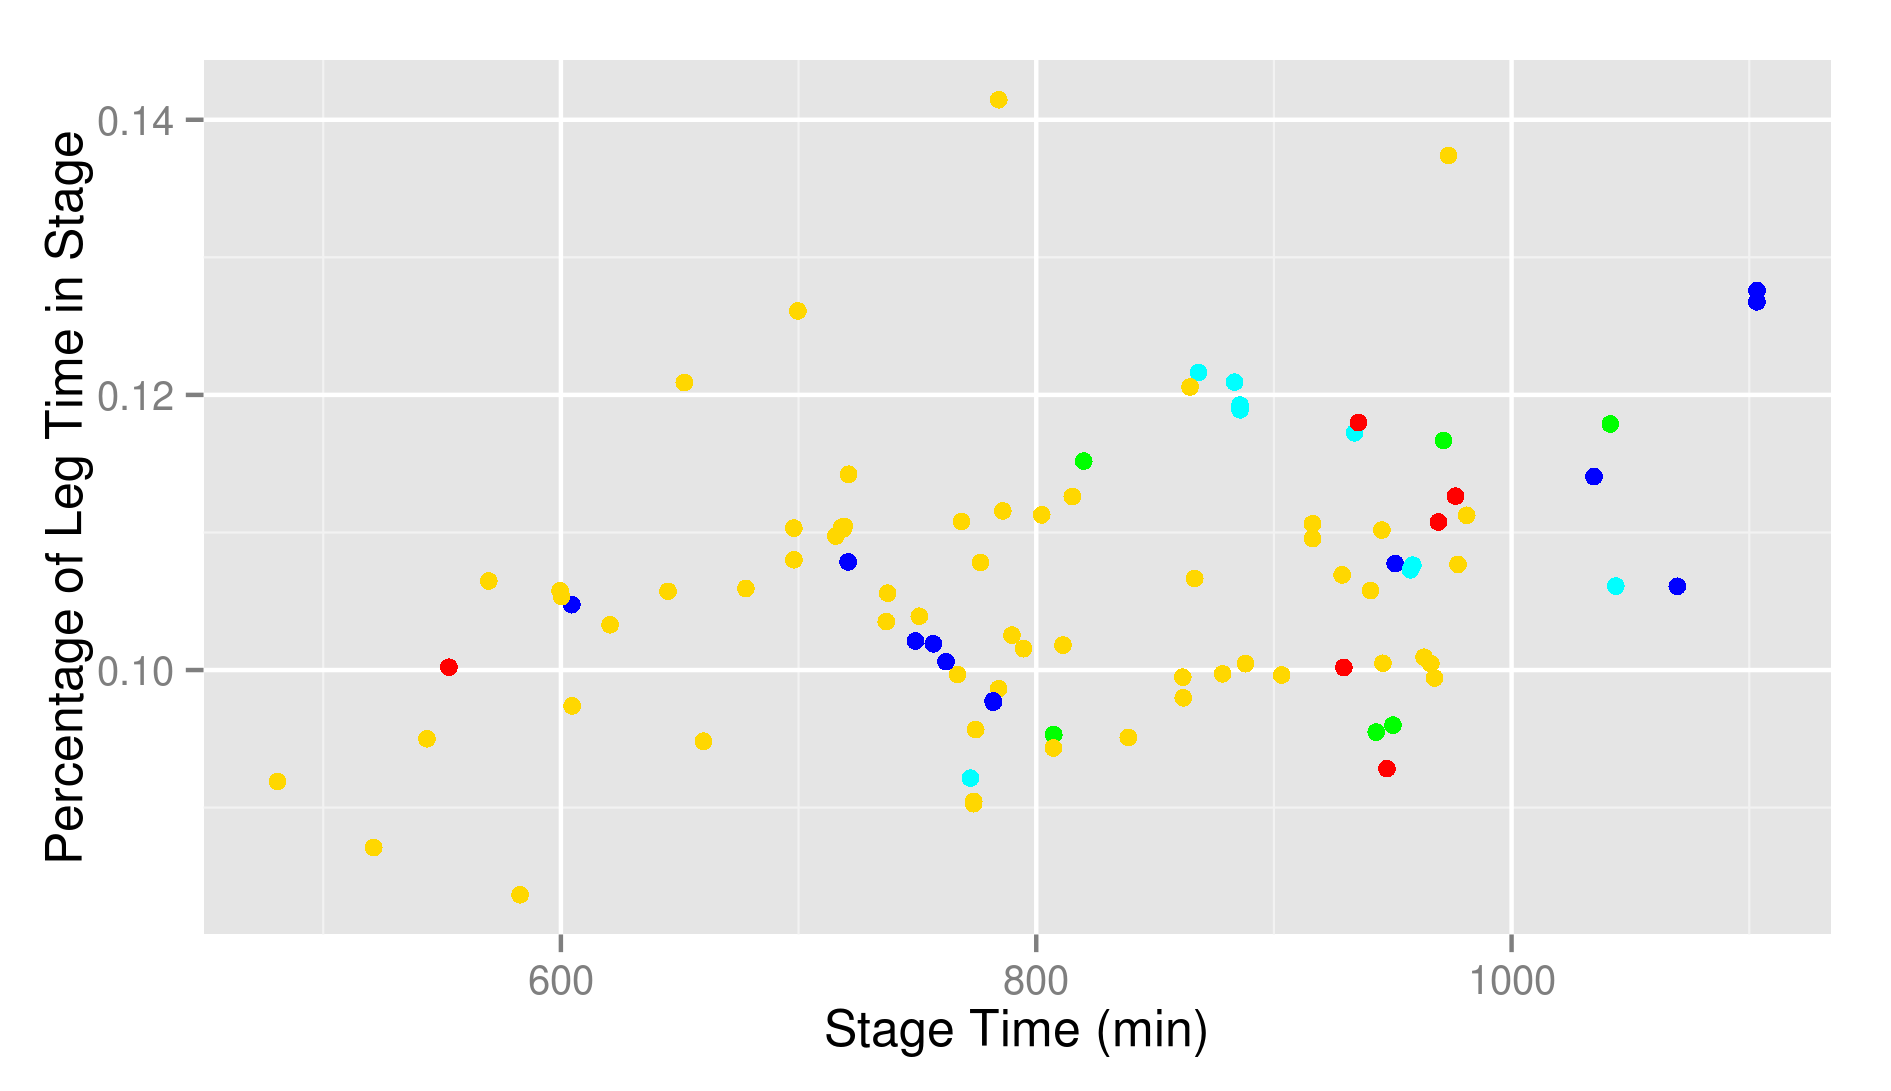
Again not very clear. The averages are 10.6% (red), 10.5% (yellow), 10.6% (green), 11.2% (cyan) and 10.8% (blue). All very close together. I probably would avoid cyan, but otherwise you can pick anything you like.
Climbing Rhinog Fach allows for even more options.
To the east we have an approach from the NE (red, 8 runners). Then, there is a rather straight line with an approach from the north (yellow, 17 runners). All others entered the valley to the west of Rhinog Fach. There they climbed the west face of the mountain following the green (7 runners), cyan (35 runners) or blue (2 runners) lines. Some went even past the summit to climb it from the south (magenta, 15 runners). Finally, there is black, which is basically magenta with a somewhat shorter turn in the end (8 runners).

There is no clear winner, but visually I would say that cyan and red are the most promising options. The only one that looks really bad is blue, but that are only two slower runners together. The means and a 95%-confidence interval for the different colours are 10.0% (red, 9.7-10.3%), 10.8% (yellow, 10.5-11.1%), 10.9% (green, 9.8-12.1%), 10.2% (cyan, 9.9-10.4%), 11.3% (magenta, 10.7-12.0%) and 10.9% (black, 10.4-11.4%). I would probably go for red as that has the lowest variance.
Leg 8
The fastest time was run by Jim Mann with 20.4 minutes.
The median time was 39.3 minutes.
This is simply following a ridge. At least, that is what I tought.

Apparently we can argue which side of the lake is the best to take. Nine runners decided that going to the west would be best (yellow), while 81 went to the east (red).
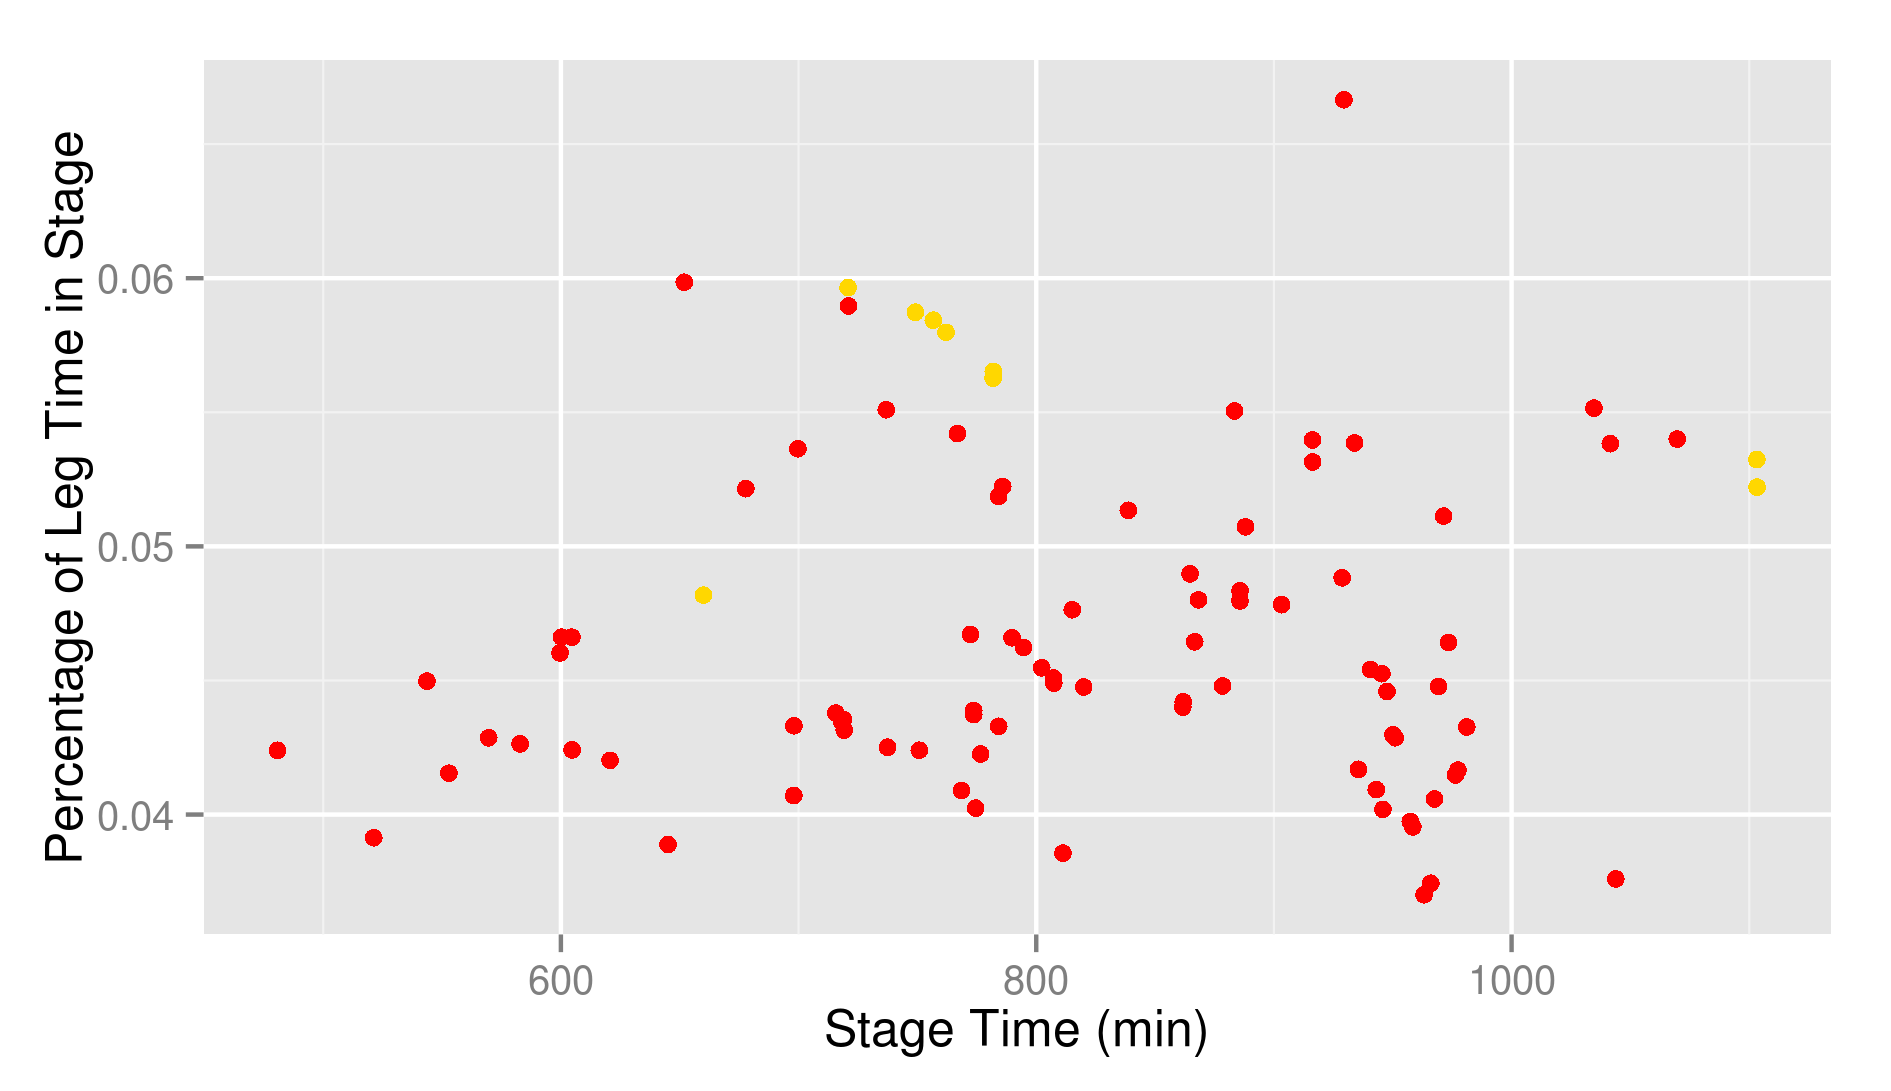
The argument can stop right here. The red line is the best one. No doubt about that.
Leg 9
The fastest time was run by Jim Mann with 23.4 minutes.
The median time was 40.6 minutes.
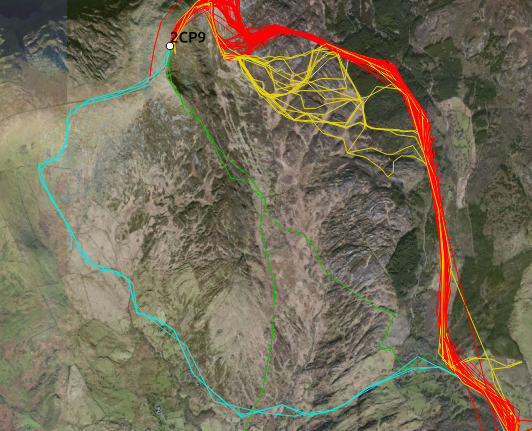
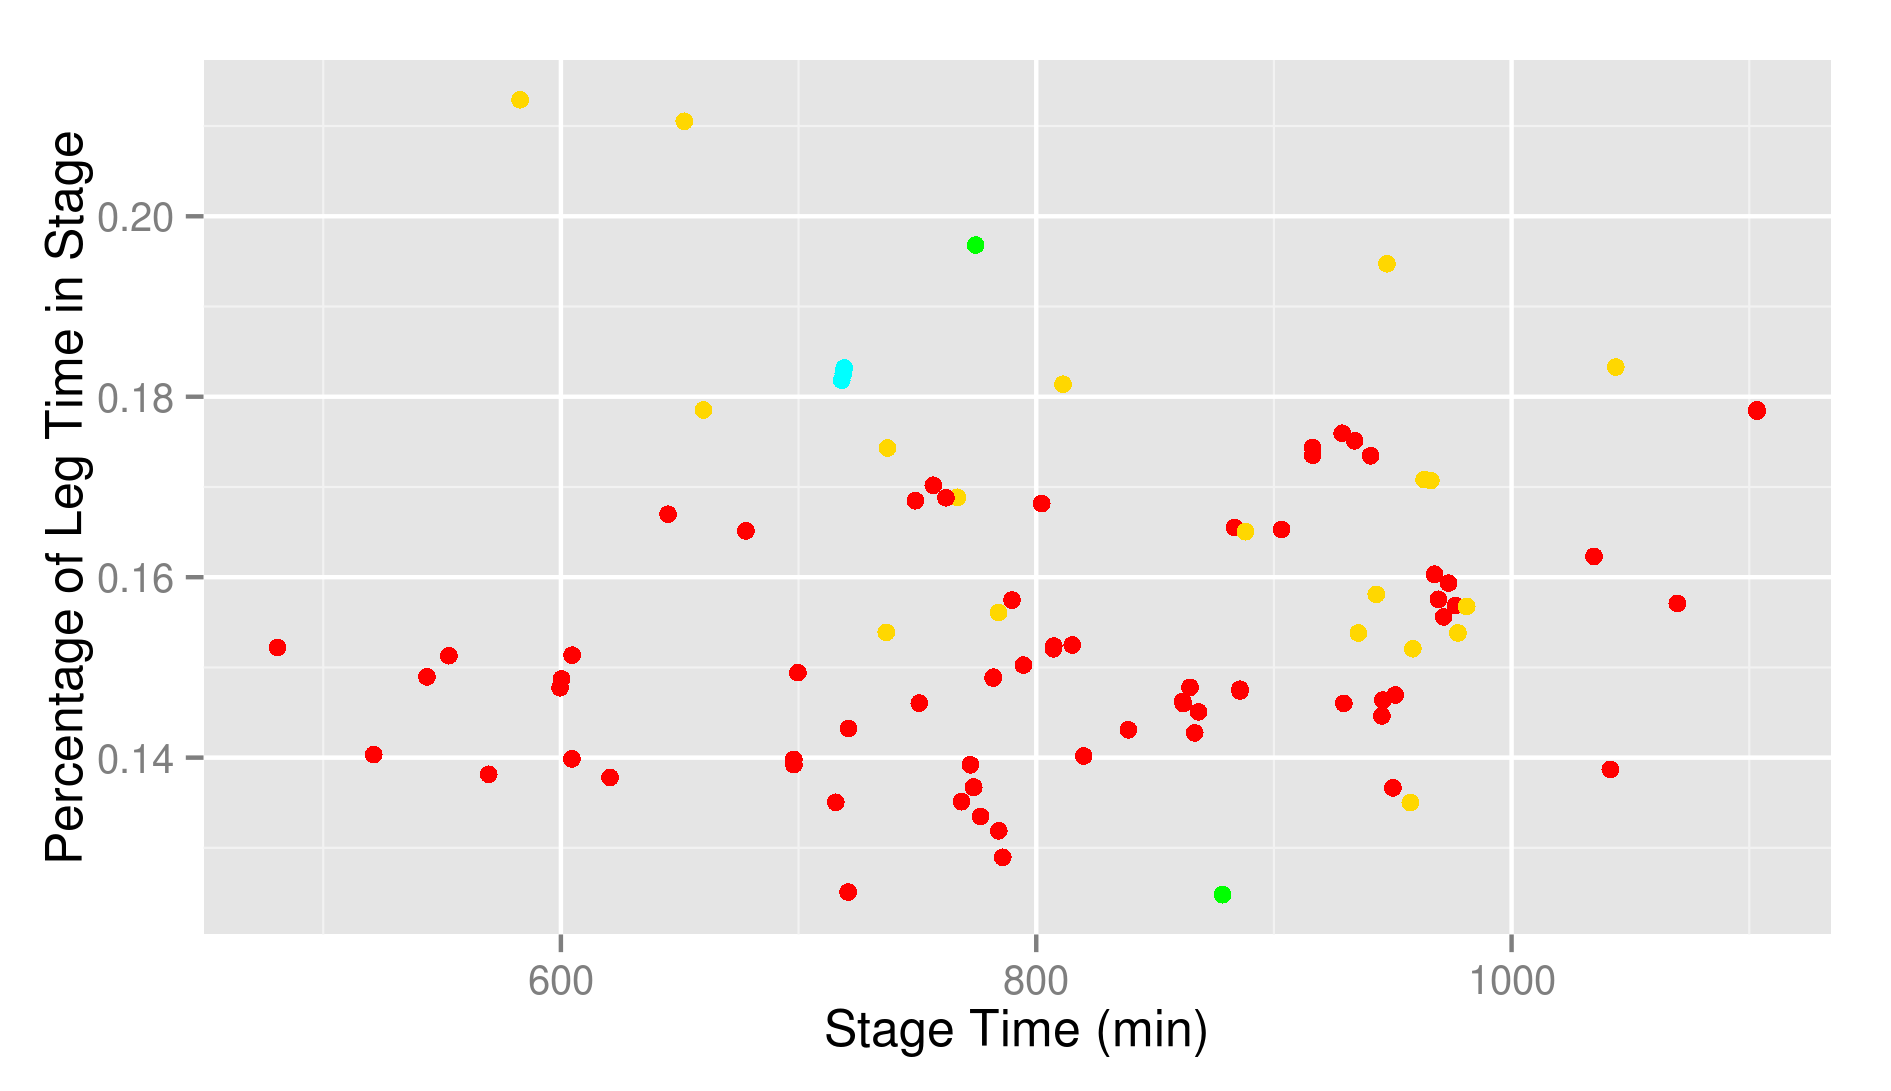
During this stage you also follow the ridgeline, but it is a bit more subtle. The ridge turns a bit and has some intermediate summits. Should you stick to ridge or go a little lower?
I identified three major bands: eastmost and highest yellow (25 runners), somewhat lower and to the west green (24 runners) and still lower and further westward cyan (39 runners). There are some particular cases that I identified separately. The first one are two runners (Iestyn and Lloyd) that started to follow a wrong ridge (red). The blue line is someone (Joe Faulkner) who went very deep. And finally someone (Filip, magenta) thought it would be good to run past the summit and approach the checkpoint from the south (the backtracking is not on the map above).

There is zero difference between the three bands. Pick anything you want, it won’t make you faster or slower. Getting lost is bad, which probably surprises nobody and also magenta is not very good. I’m a bit surprised by the good score of Joe in blue. He might be onto something.
Leg 10
The fastest time was run by Jasmin Paris with 73.2 minutes.
The median time was 126.3 minutes.
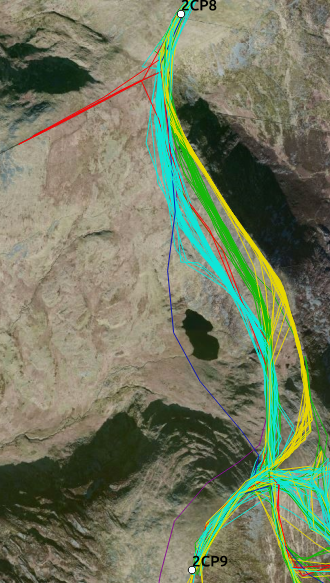
Here you run down from the last checkpoint. Once you get in the valley there is a mandatory route to follow. So, we are only interested in the different possibilities to get down.
The most straightforward way is to backtrack a little after the checkpoint and follow a path that leads down (red, 68 runners). Staying on that path is clearly less obvious than it sounds because 19 runners strayed from it (yellow). And then we have some that tried to be original by continuing south after the summit. Two went straight south (green), while three runners started even SW, before turning in the right direction following some paths (cyan).
Clearly, you should stay on the path. Yellow is slower than red. The biggest victims of the straying were Damian Hall and André Jonsson. The cyan option doesn’t look any good either. Green then? Well, one dot looks terrible and one dot looks great. The one that looks terrible is the one who took a somewhat straight line SE. The going there is terrible, which makes that option very slow. I know because it’s me. The fast green line heads more south before disappearing from the map. This is a runner who continued to the road and followed the road instead of the mandatory route parallel to it. You should not consider this option, which makes green something to avoid.